Visualizing Complexity
Modular Information Design Handbook
Visualizing Complexity
Modular Information Design Handbook
Publication date: May 2022
Languages: English / German
Publisher: Birkhäuser
Volume: 224 Pages
ISBN: 9783035625042
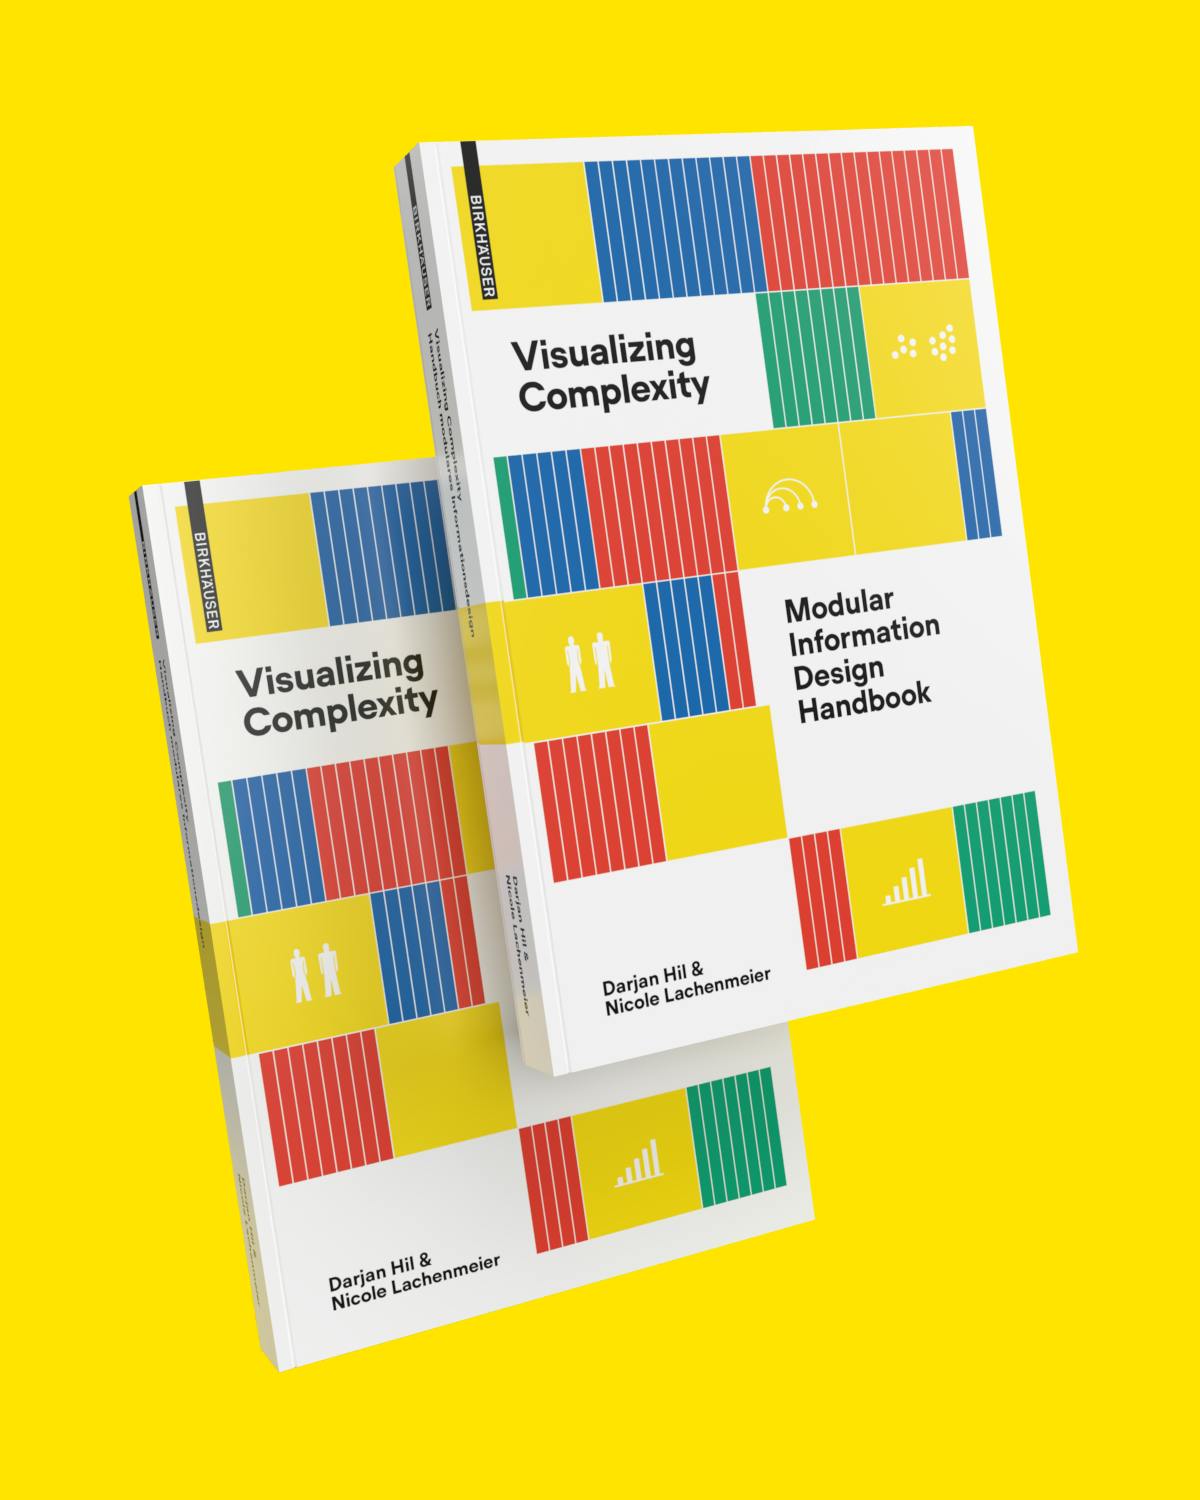
How can you turn dry statistics into attractive and informative graphs? How can you present complex data sets in an easily understandable way? How can you create narrative diagrams from unstructured data? This handbook of information design answers these questions.
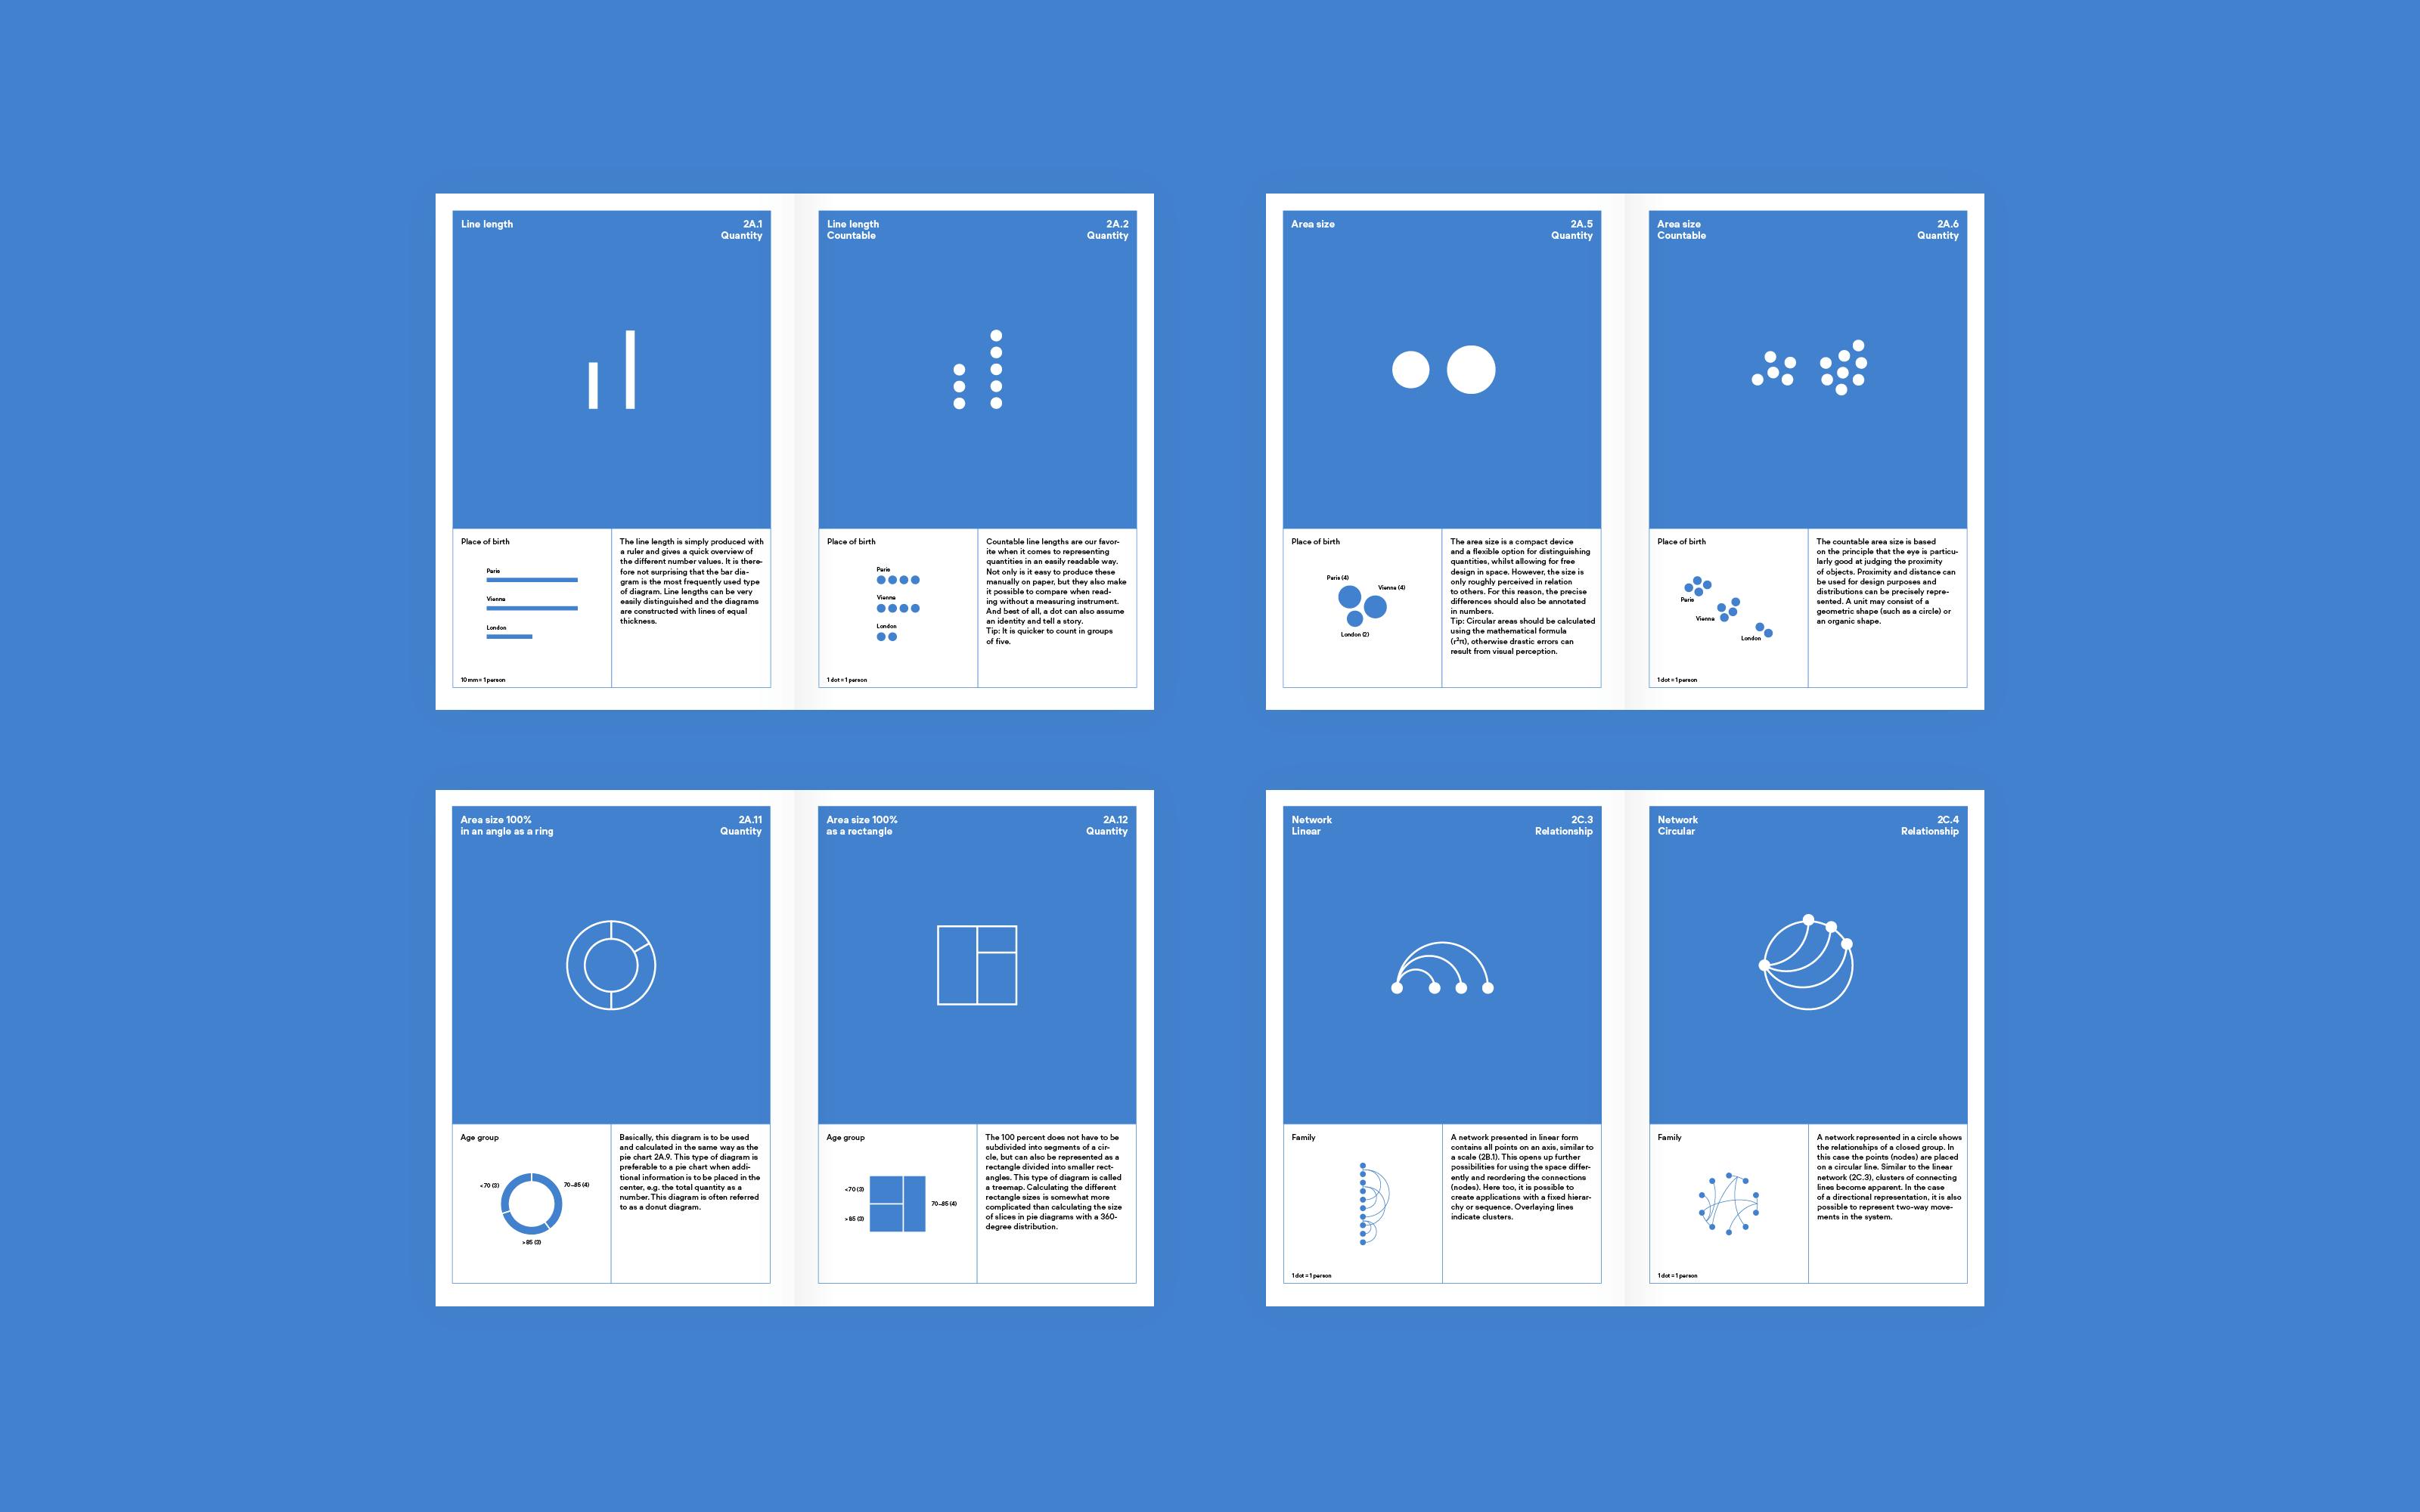
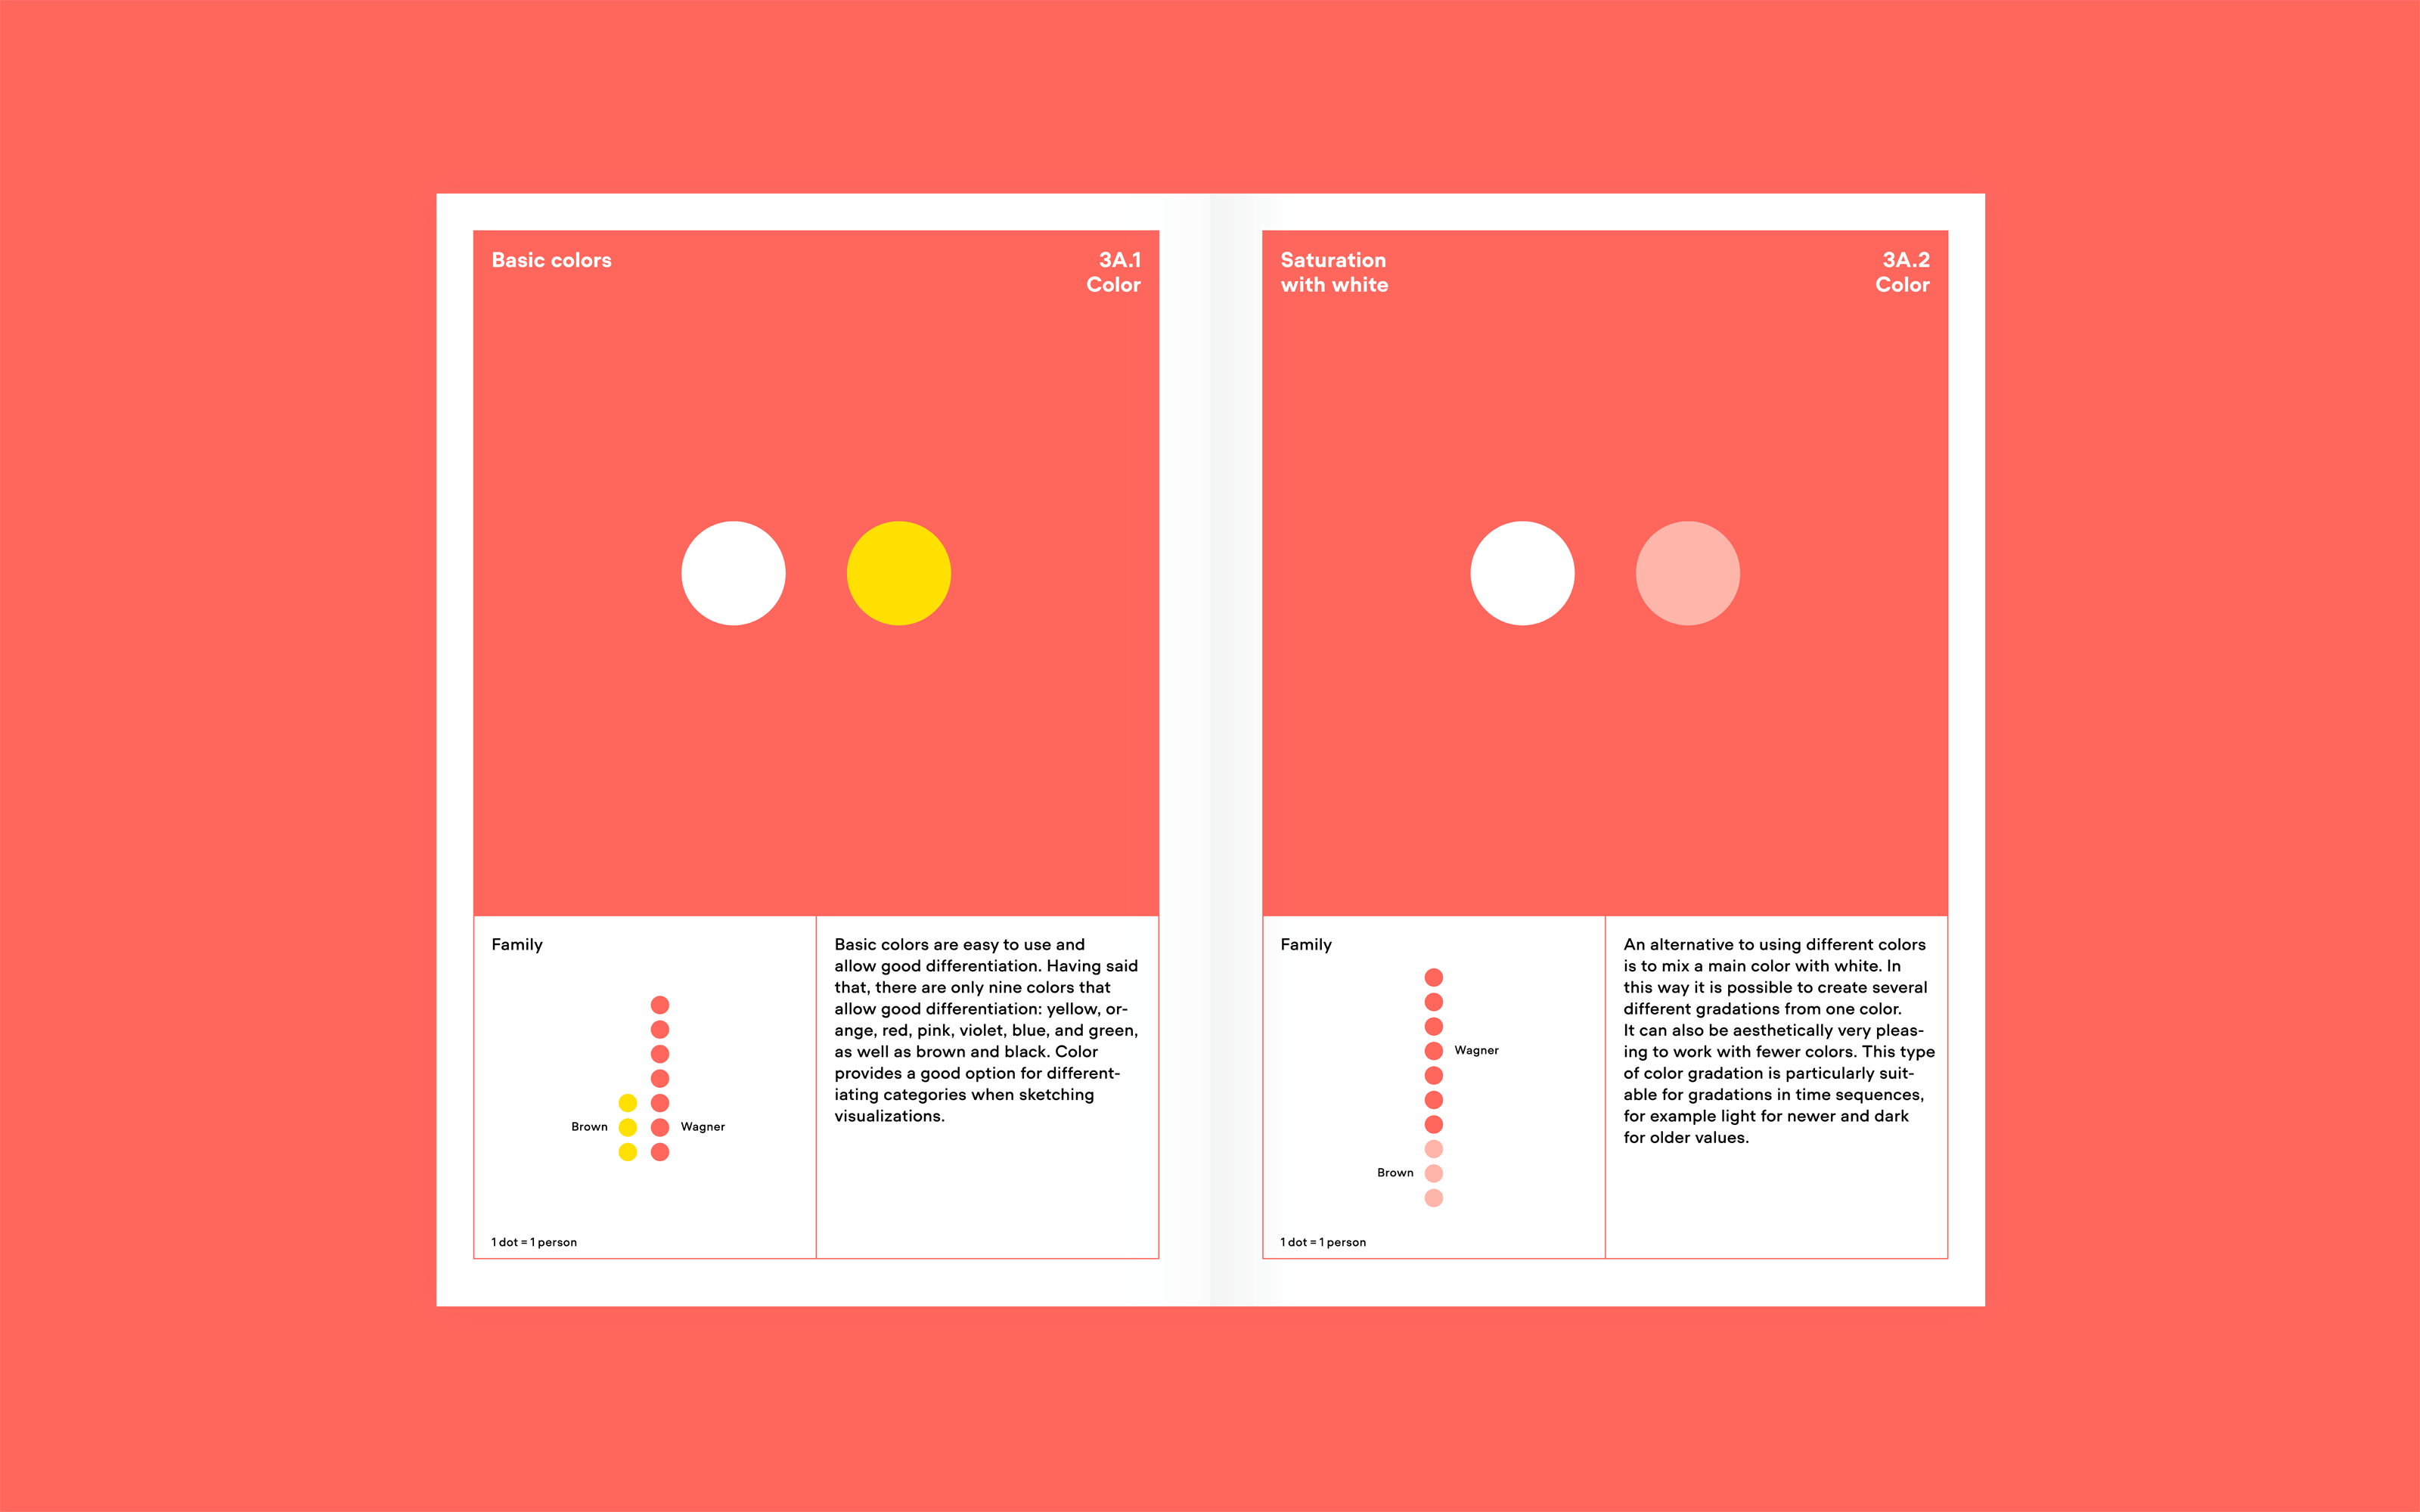
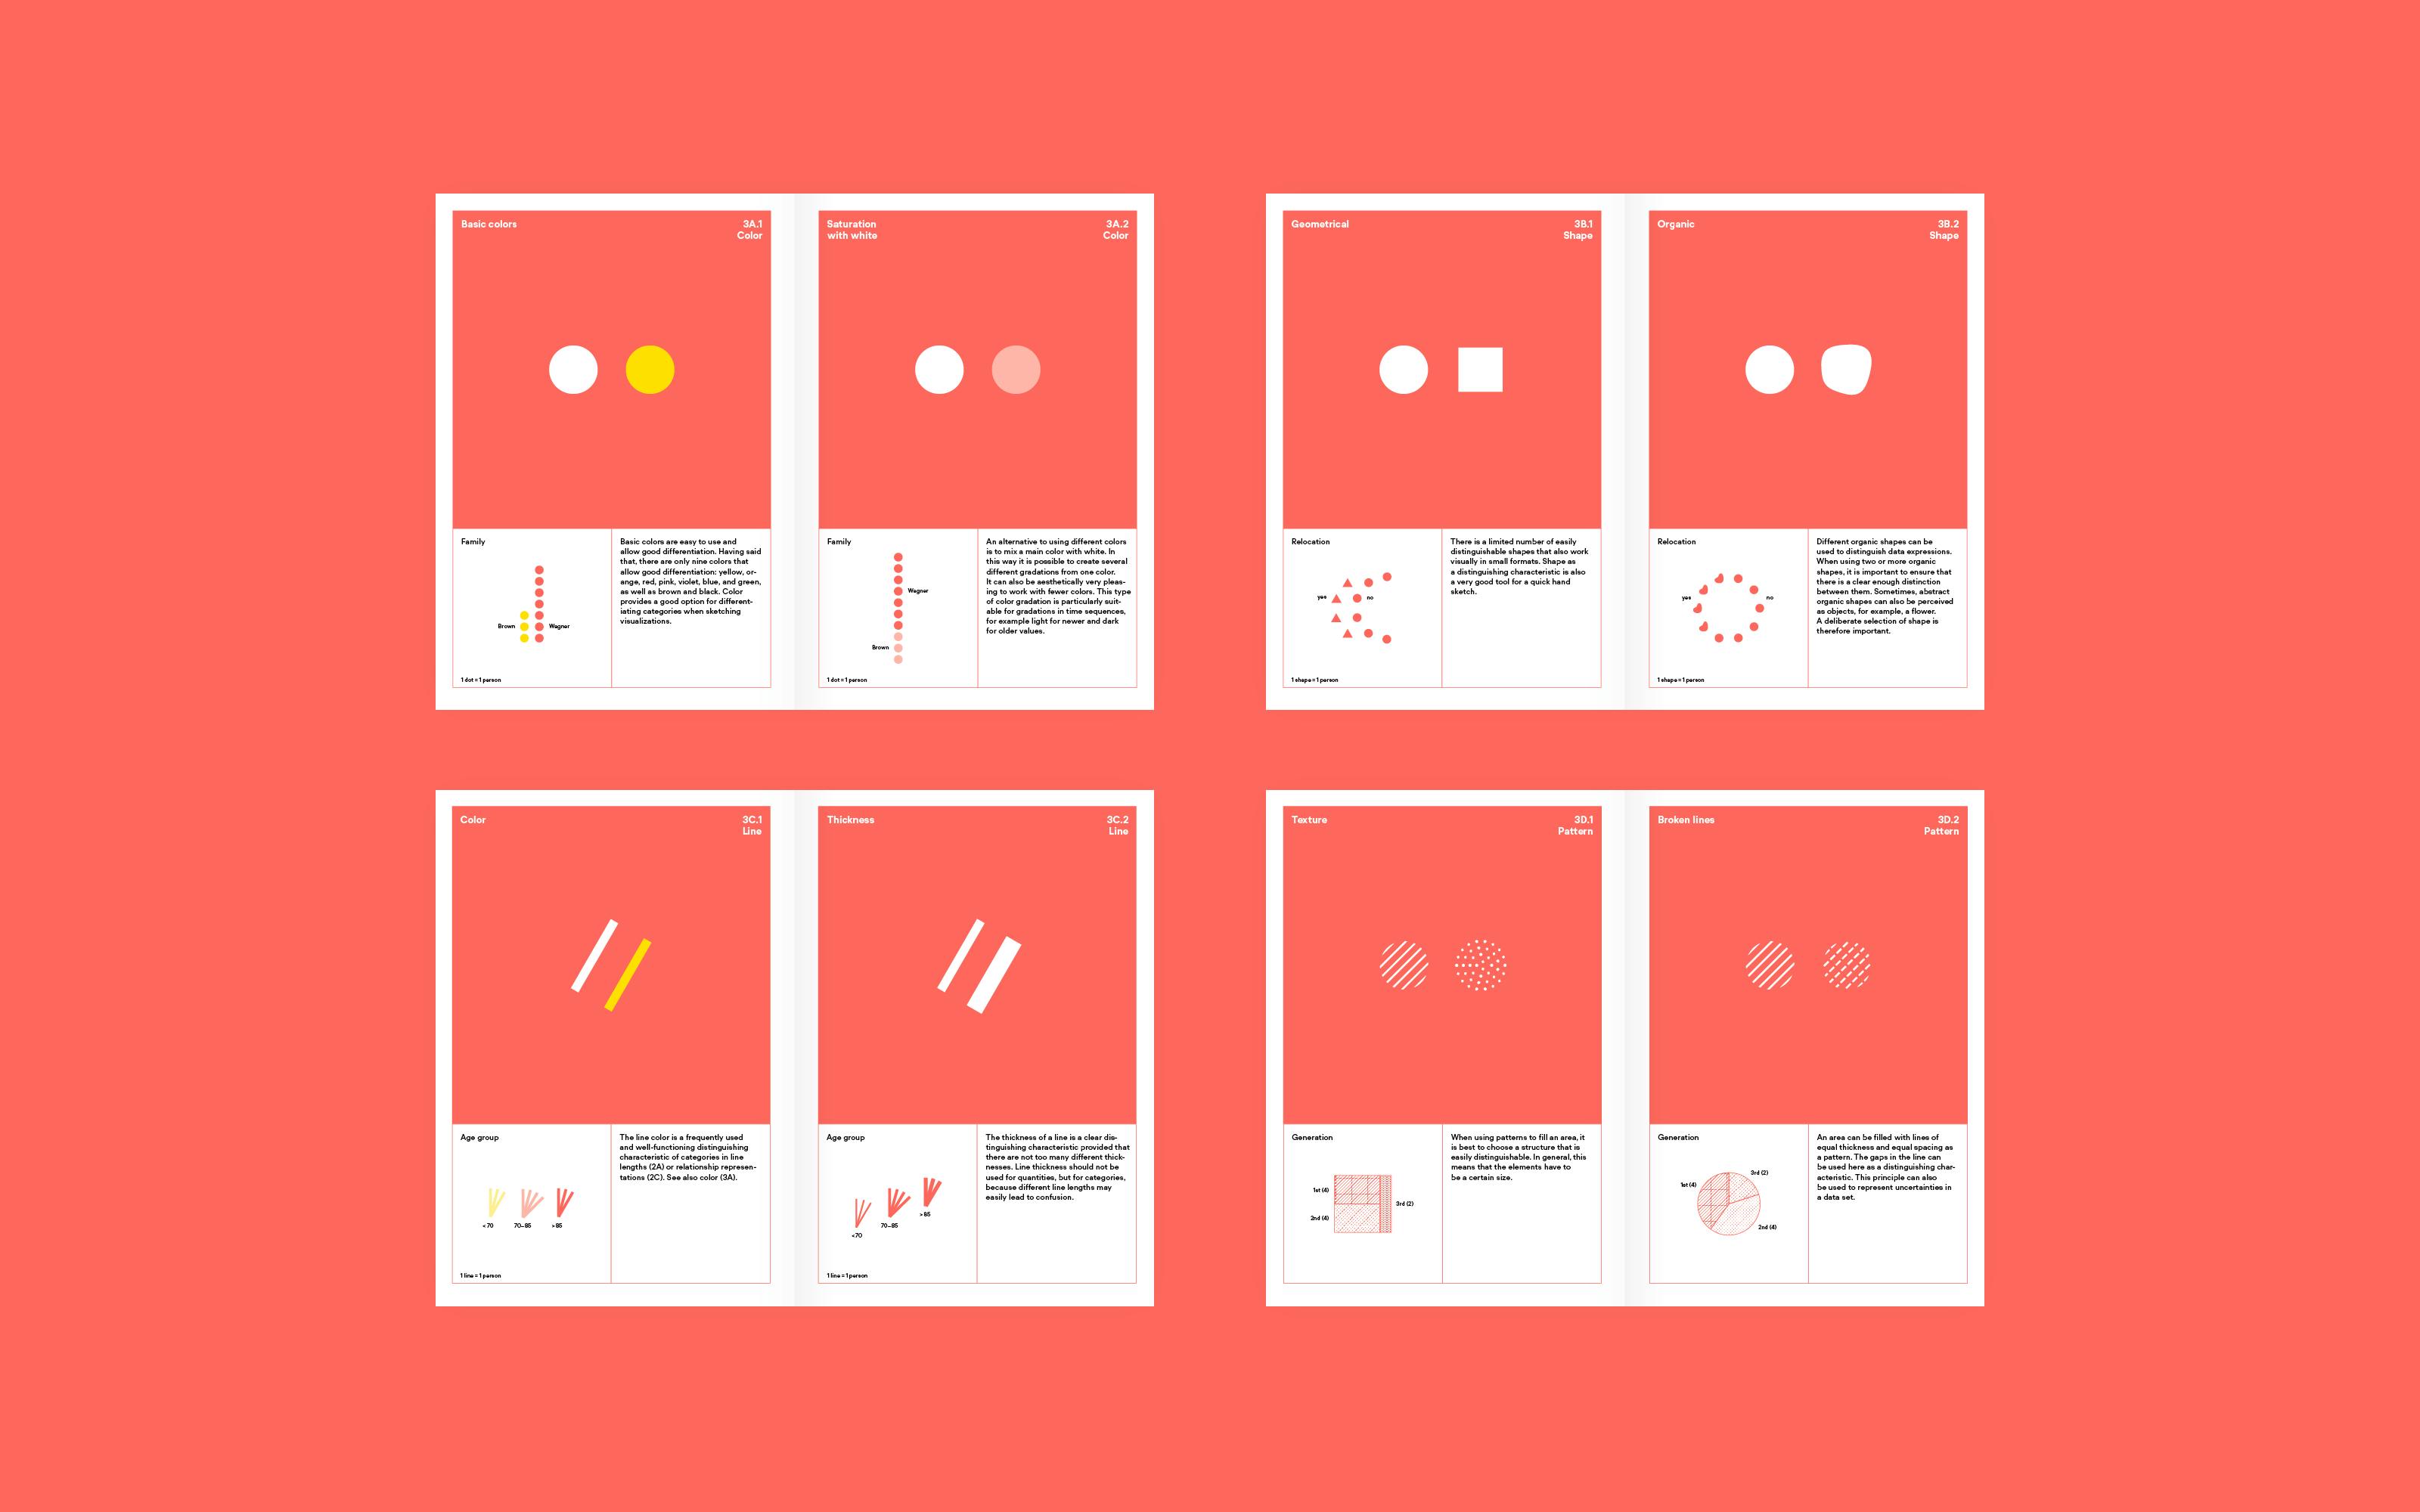
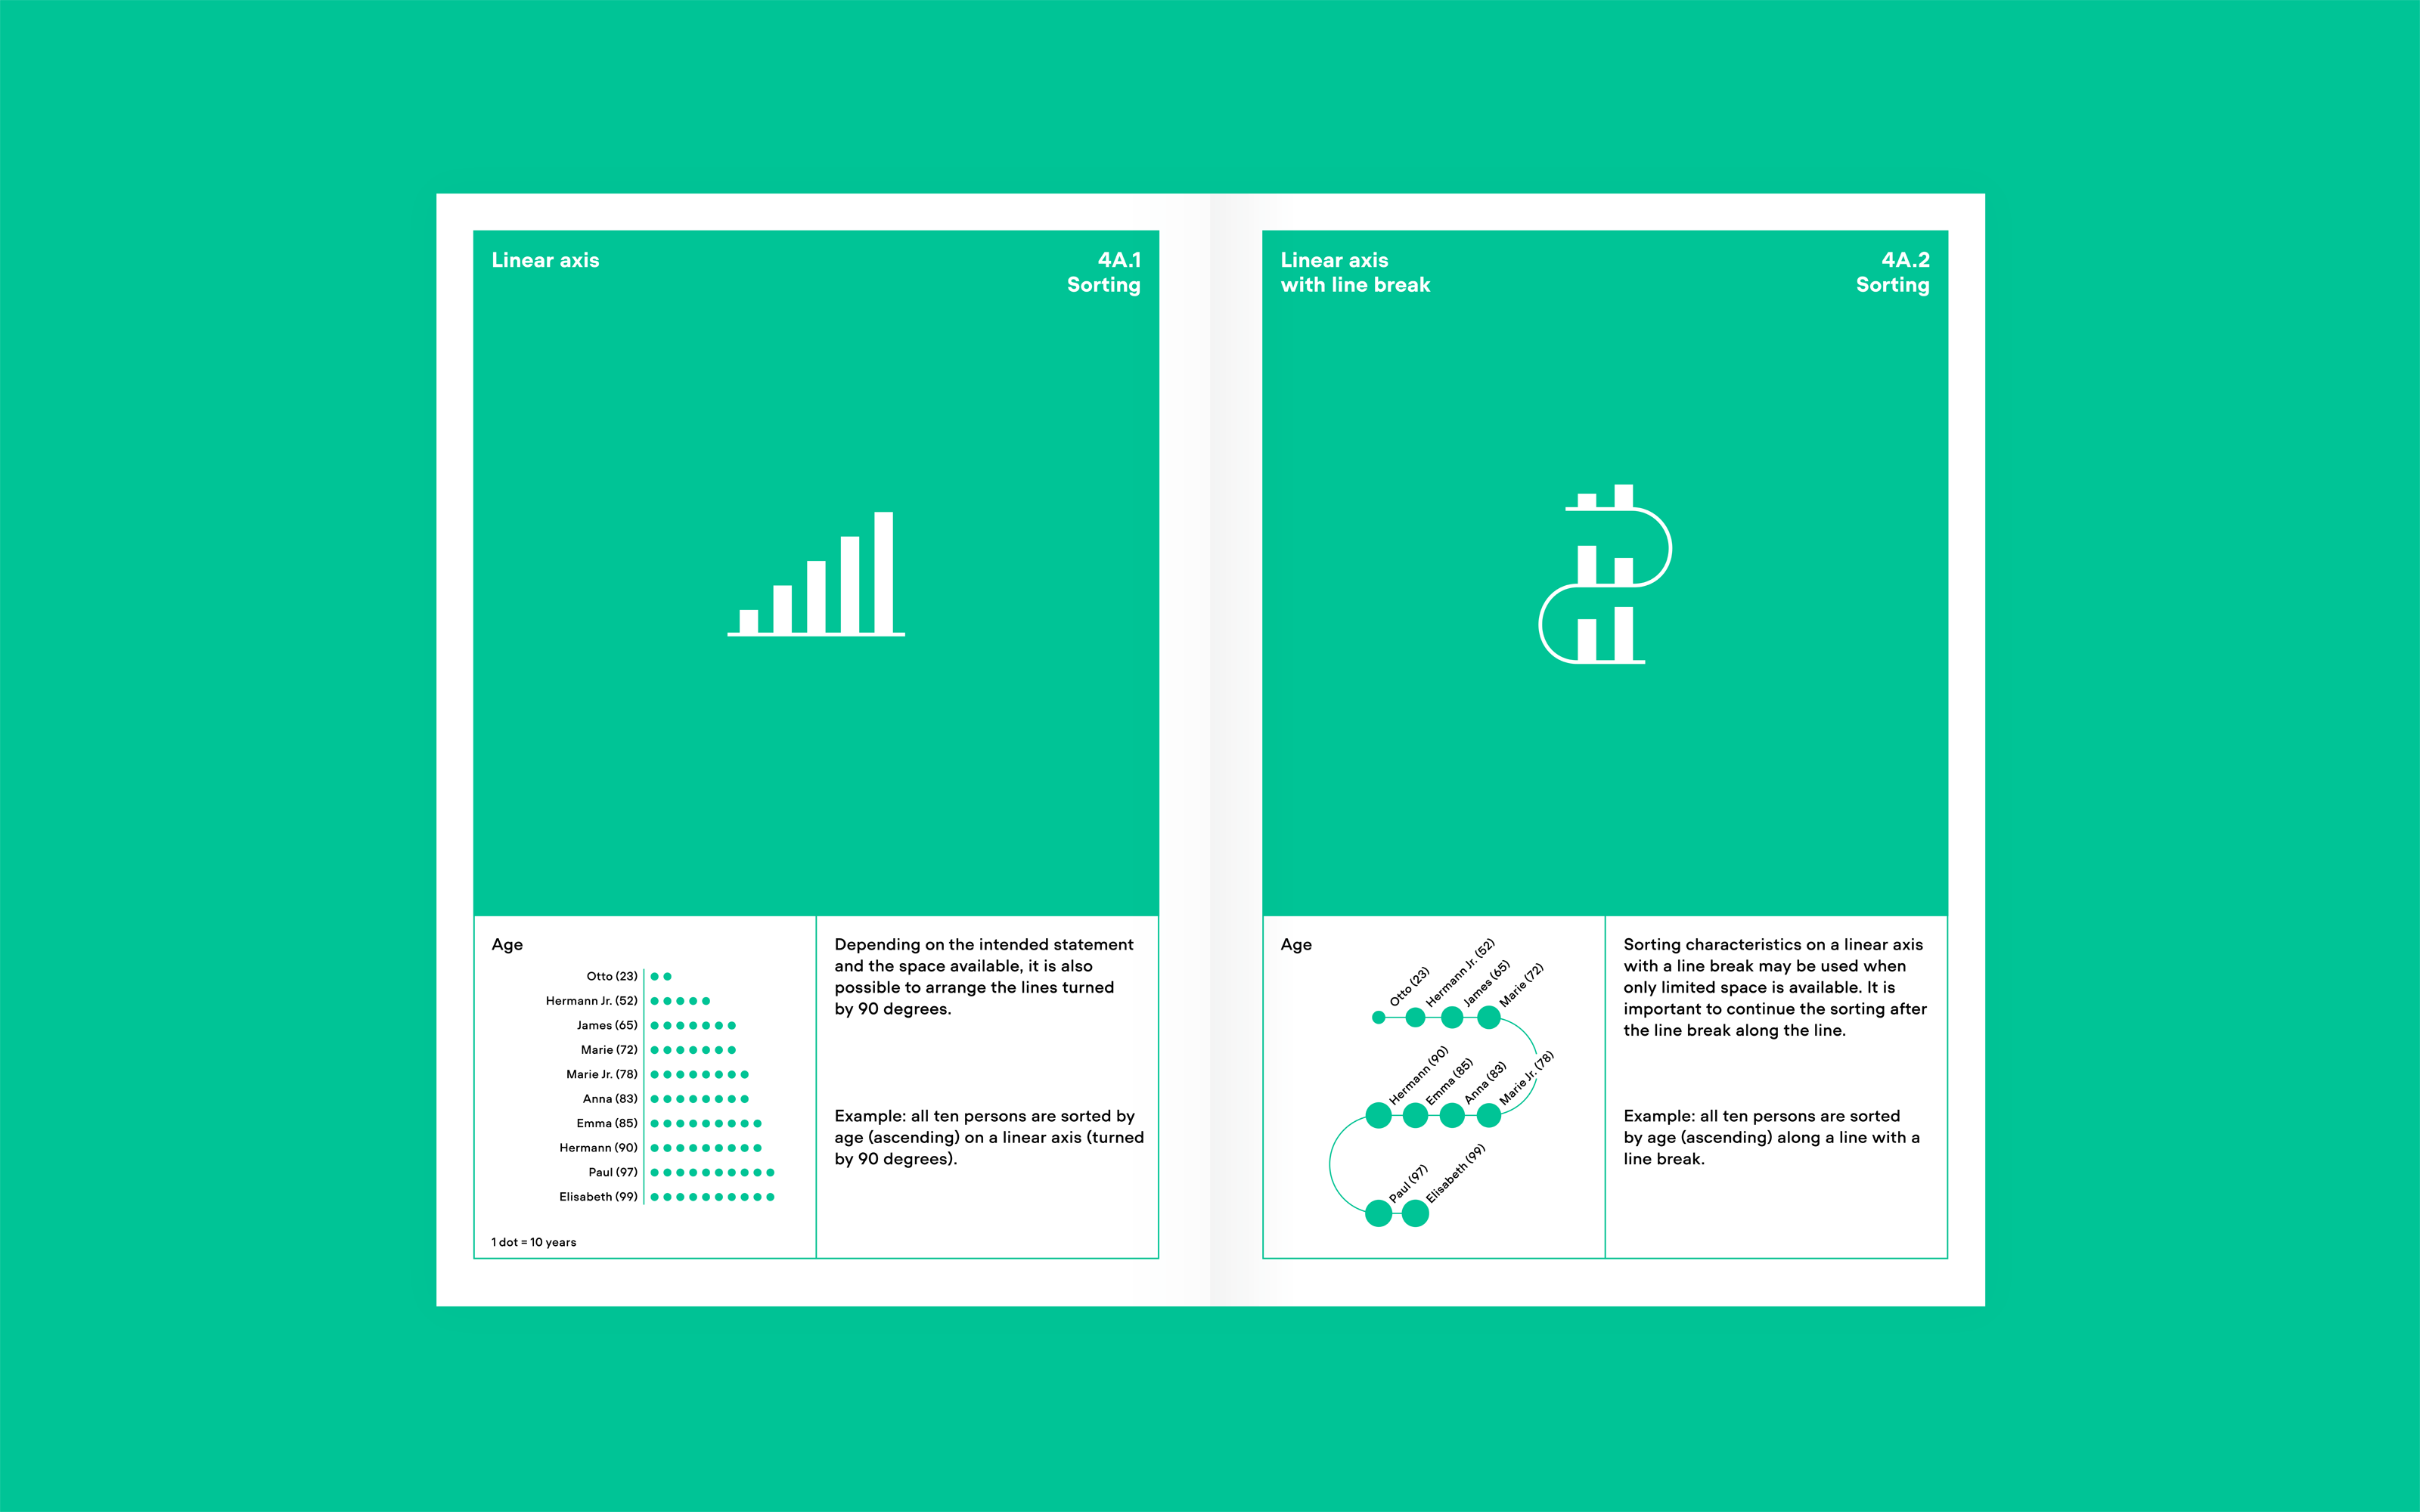
Nicole Lachenmeier and Darjan Hil condense their extensive professional experience into an illustrated guide that offers a modular design system comprised of 80 elements. Their systematic design methodology makes it possible for anyone to visualize complex data attractively and using different perspectives.
At the intersection of design, journalism, communication and data science, Visualizing Complexity opens up new ways of working with abstract data and invites readers to try their hands at information design.
- New standard work for information design
- Attractively designed and illustrated manual
- Innovative presentation solutions for analogue and digital media
- Watch Nicole Lachenmeier's talk on Modular Information Design on Youtube
Testimonials
The modular design system they developed works with 4 colors and consists of 80 elements. The visuals are surprising and beautiful.
– NZZ am Sonntag
I love the analytical, almost cookbook-like #dataviz approach, and the #Bauhaus-like design.
– Koen van Eeckhout, Baryon Design
This systematic design methodology makes it possible for anyone to visualize complex data attractively.
– Slanted
Awards
Gold
Joseph Binder Award · category information design
Gold
Indigo Award · category book design
Silver
German Press Association (DPA) Infographics Award · category infographics of companies, institutions, NGOs, authorities, foundations or other organizations
Bronze
International Creative Media Award · category educational textbooks, schoolbooks
FAQ
Why this book is important?
Explaining complexity isn’t always simple. Especially when you're trying to do it with information design. And if you don't know where to start, the process can be totally daunting. So we developed the easy-to-use Modular Information Design (MID) framework and laid it all out in this beautifully crafted book. Visualizing Complexity, the Modular Information Design Handbook is a functional publication that introduces MID — an adaptive system for anyone wishing to communicate information through design. Modular Information Design is a straightforward and user-friendly way of transforming complex or unstructured numbers and texts into creative and playful designs.
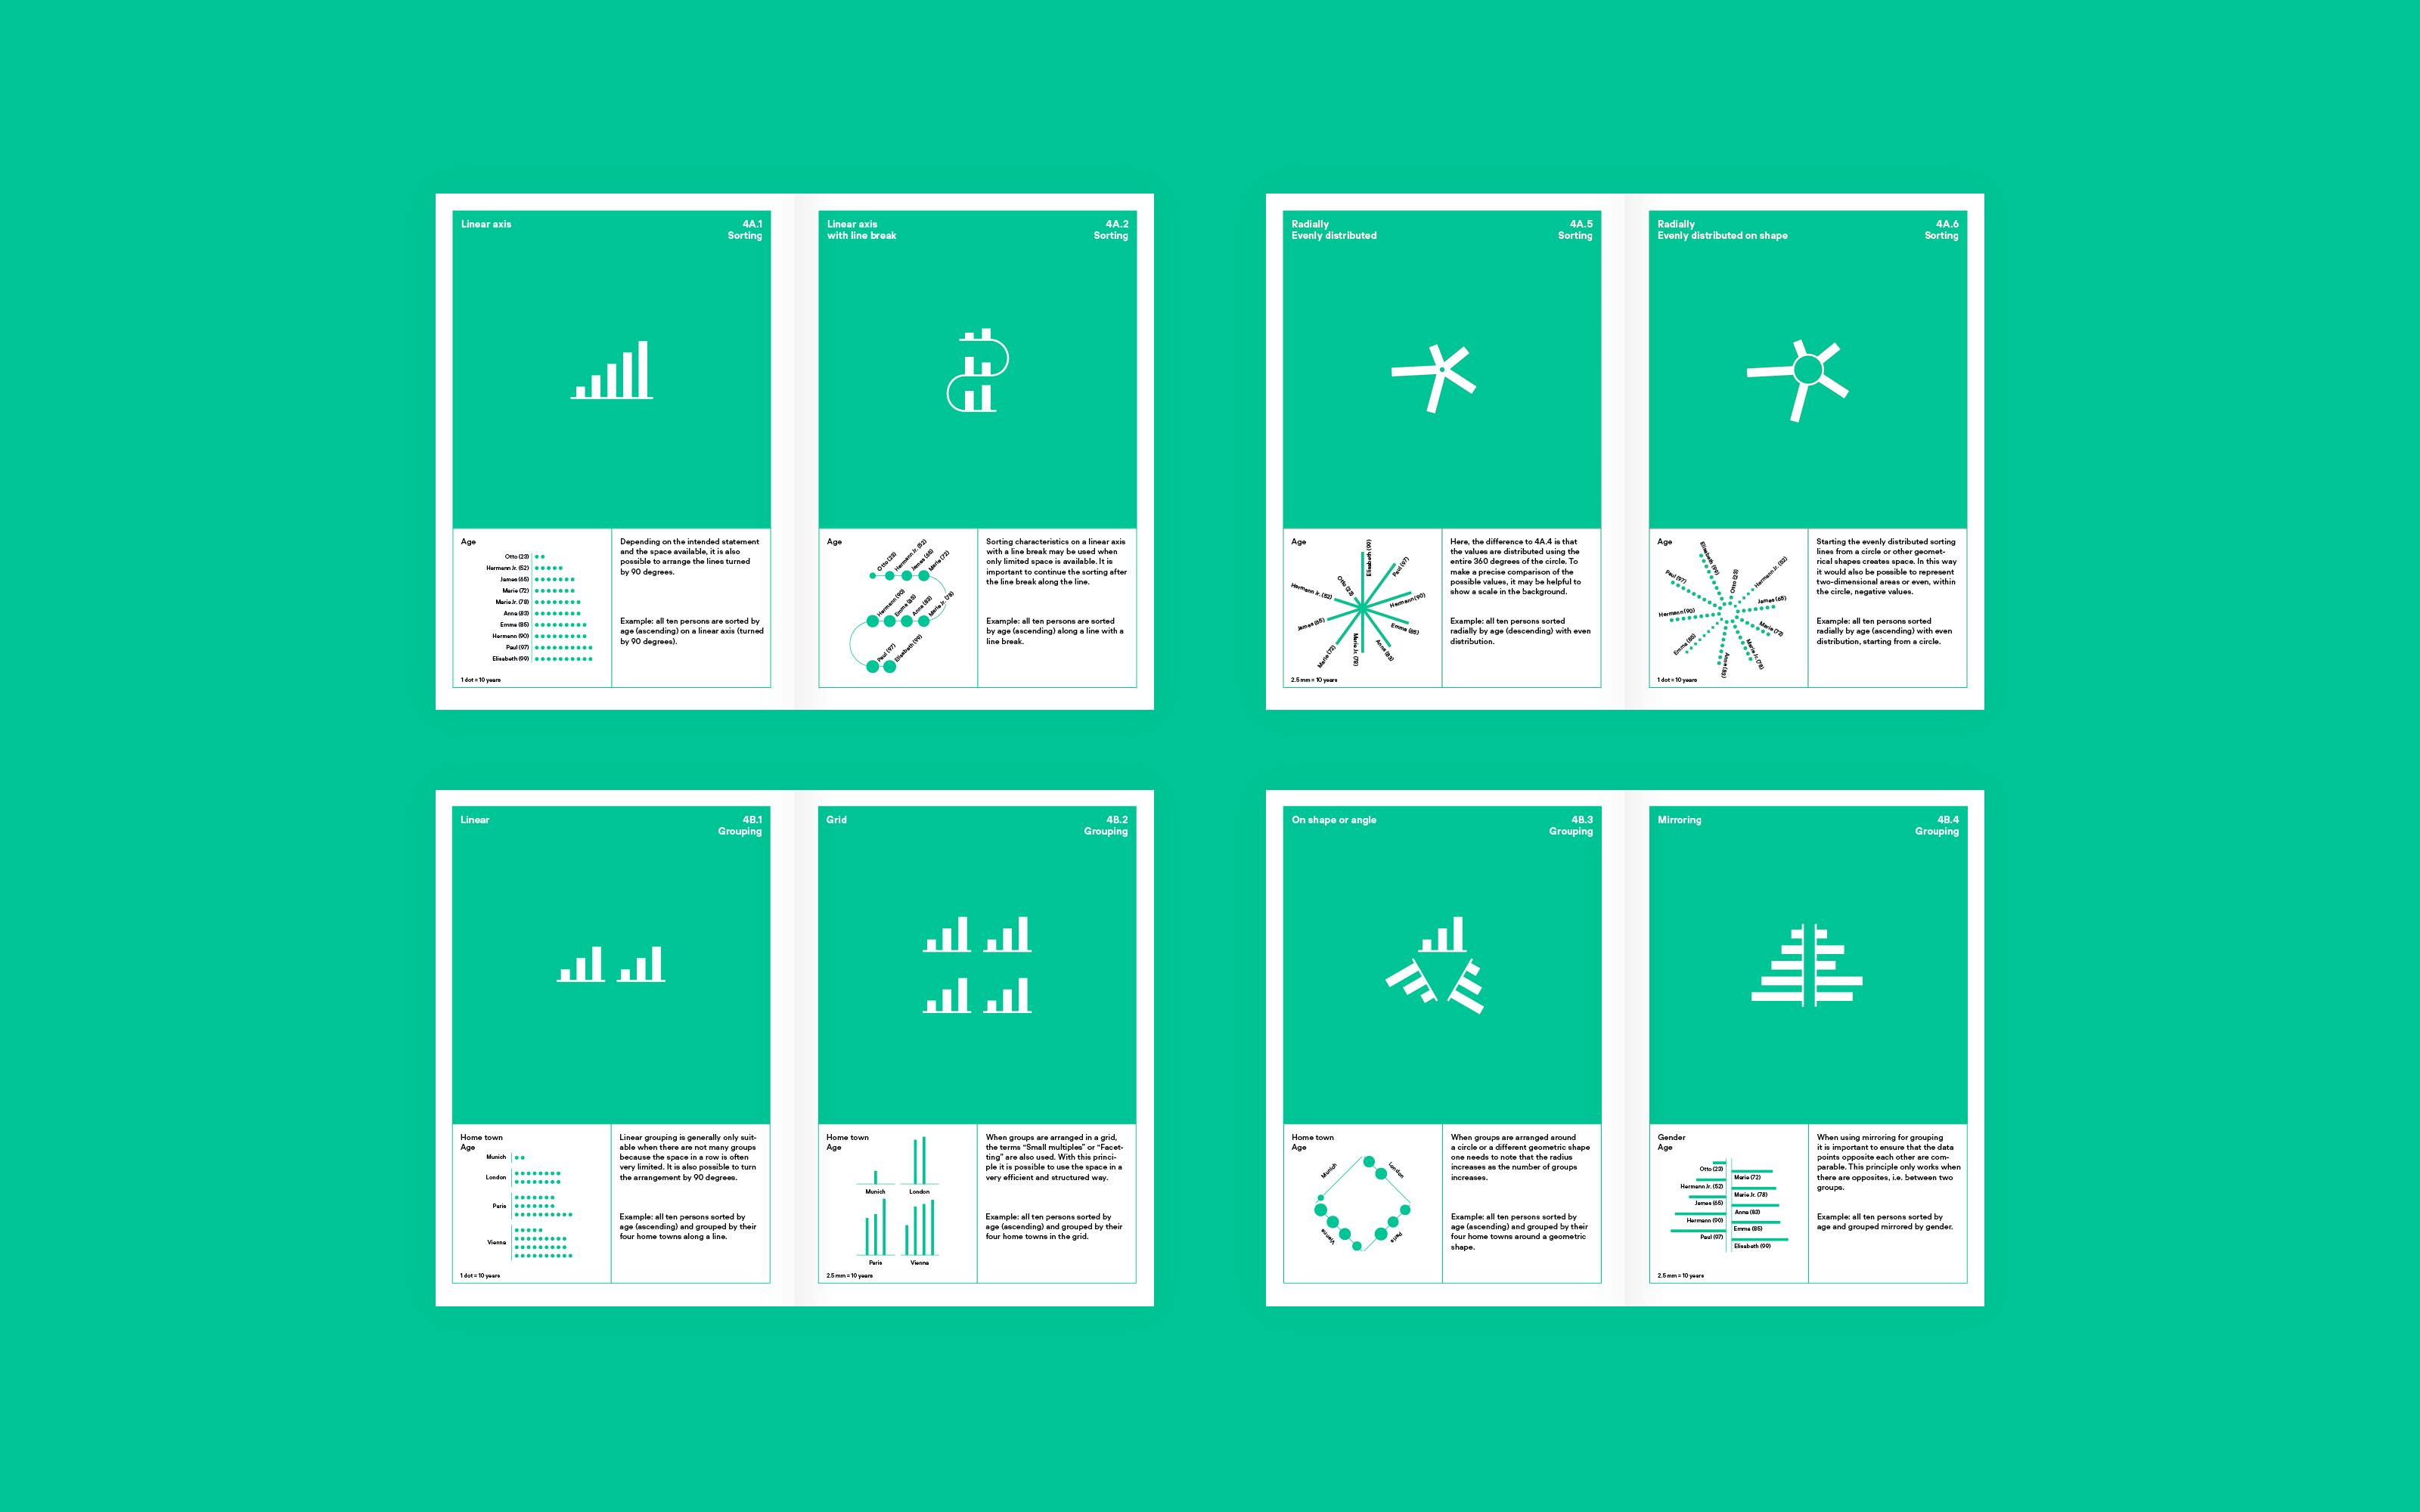
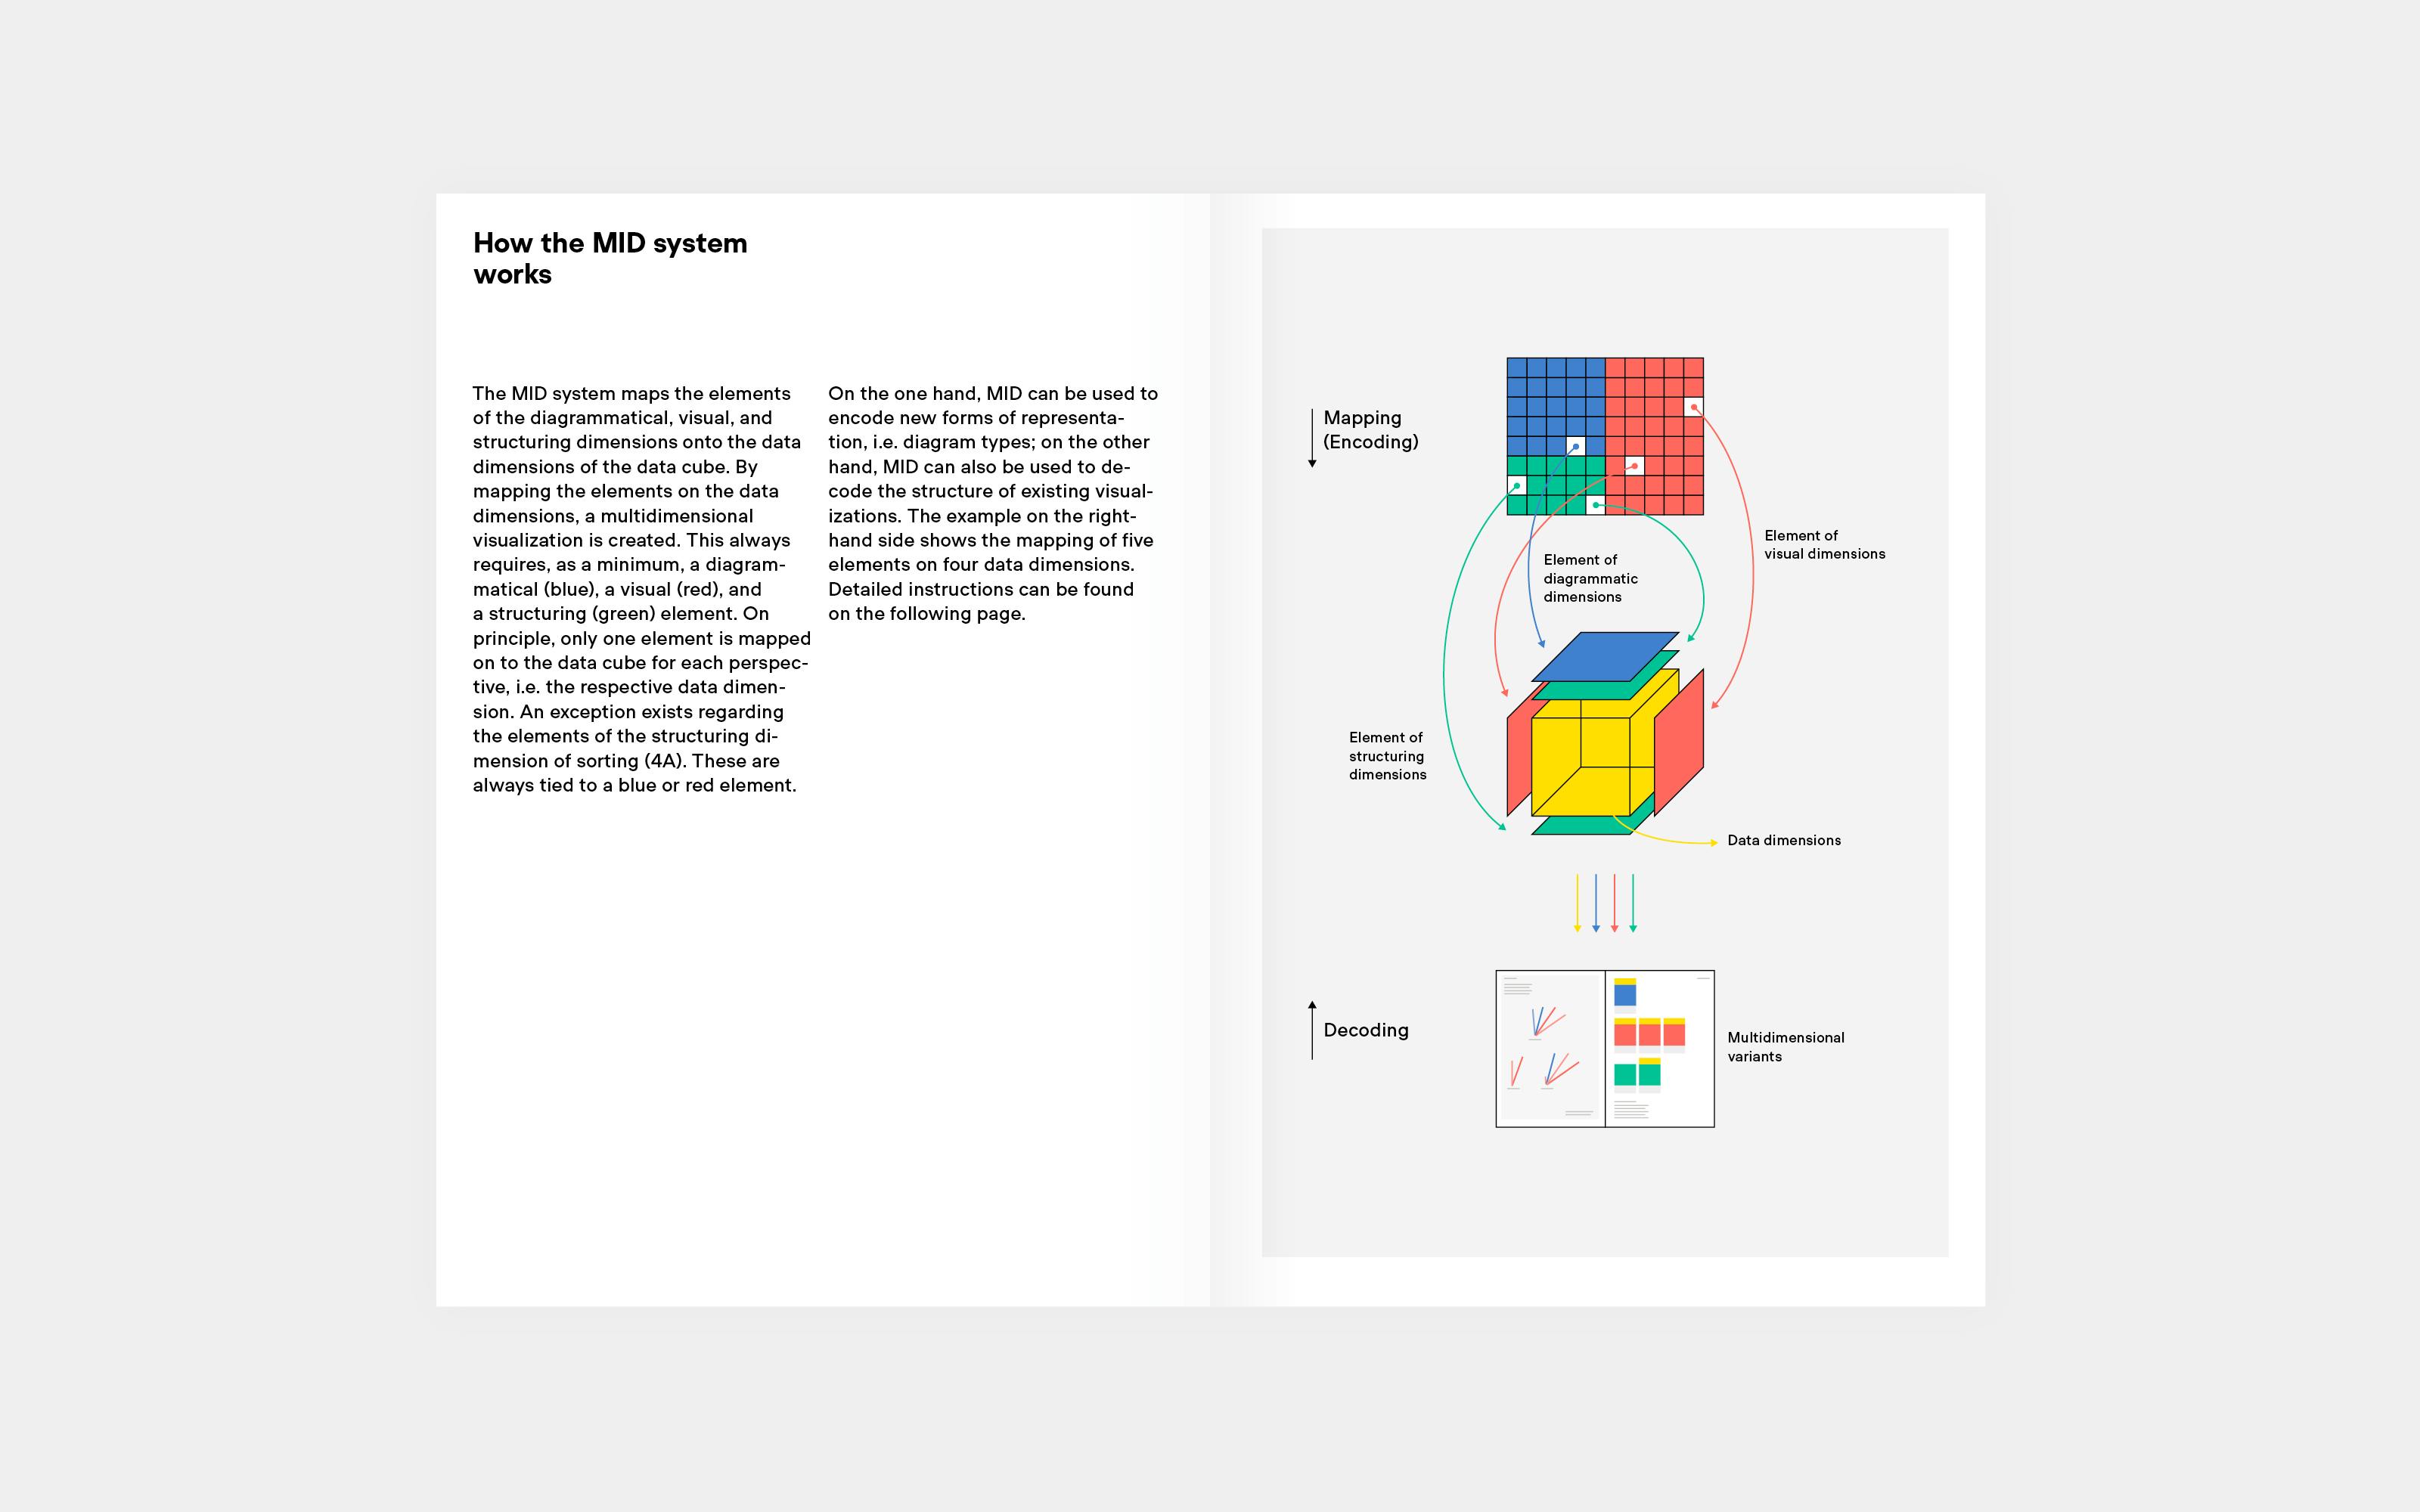
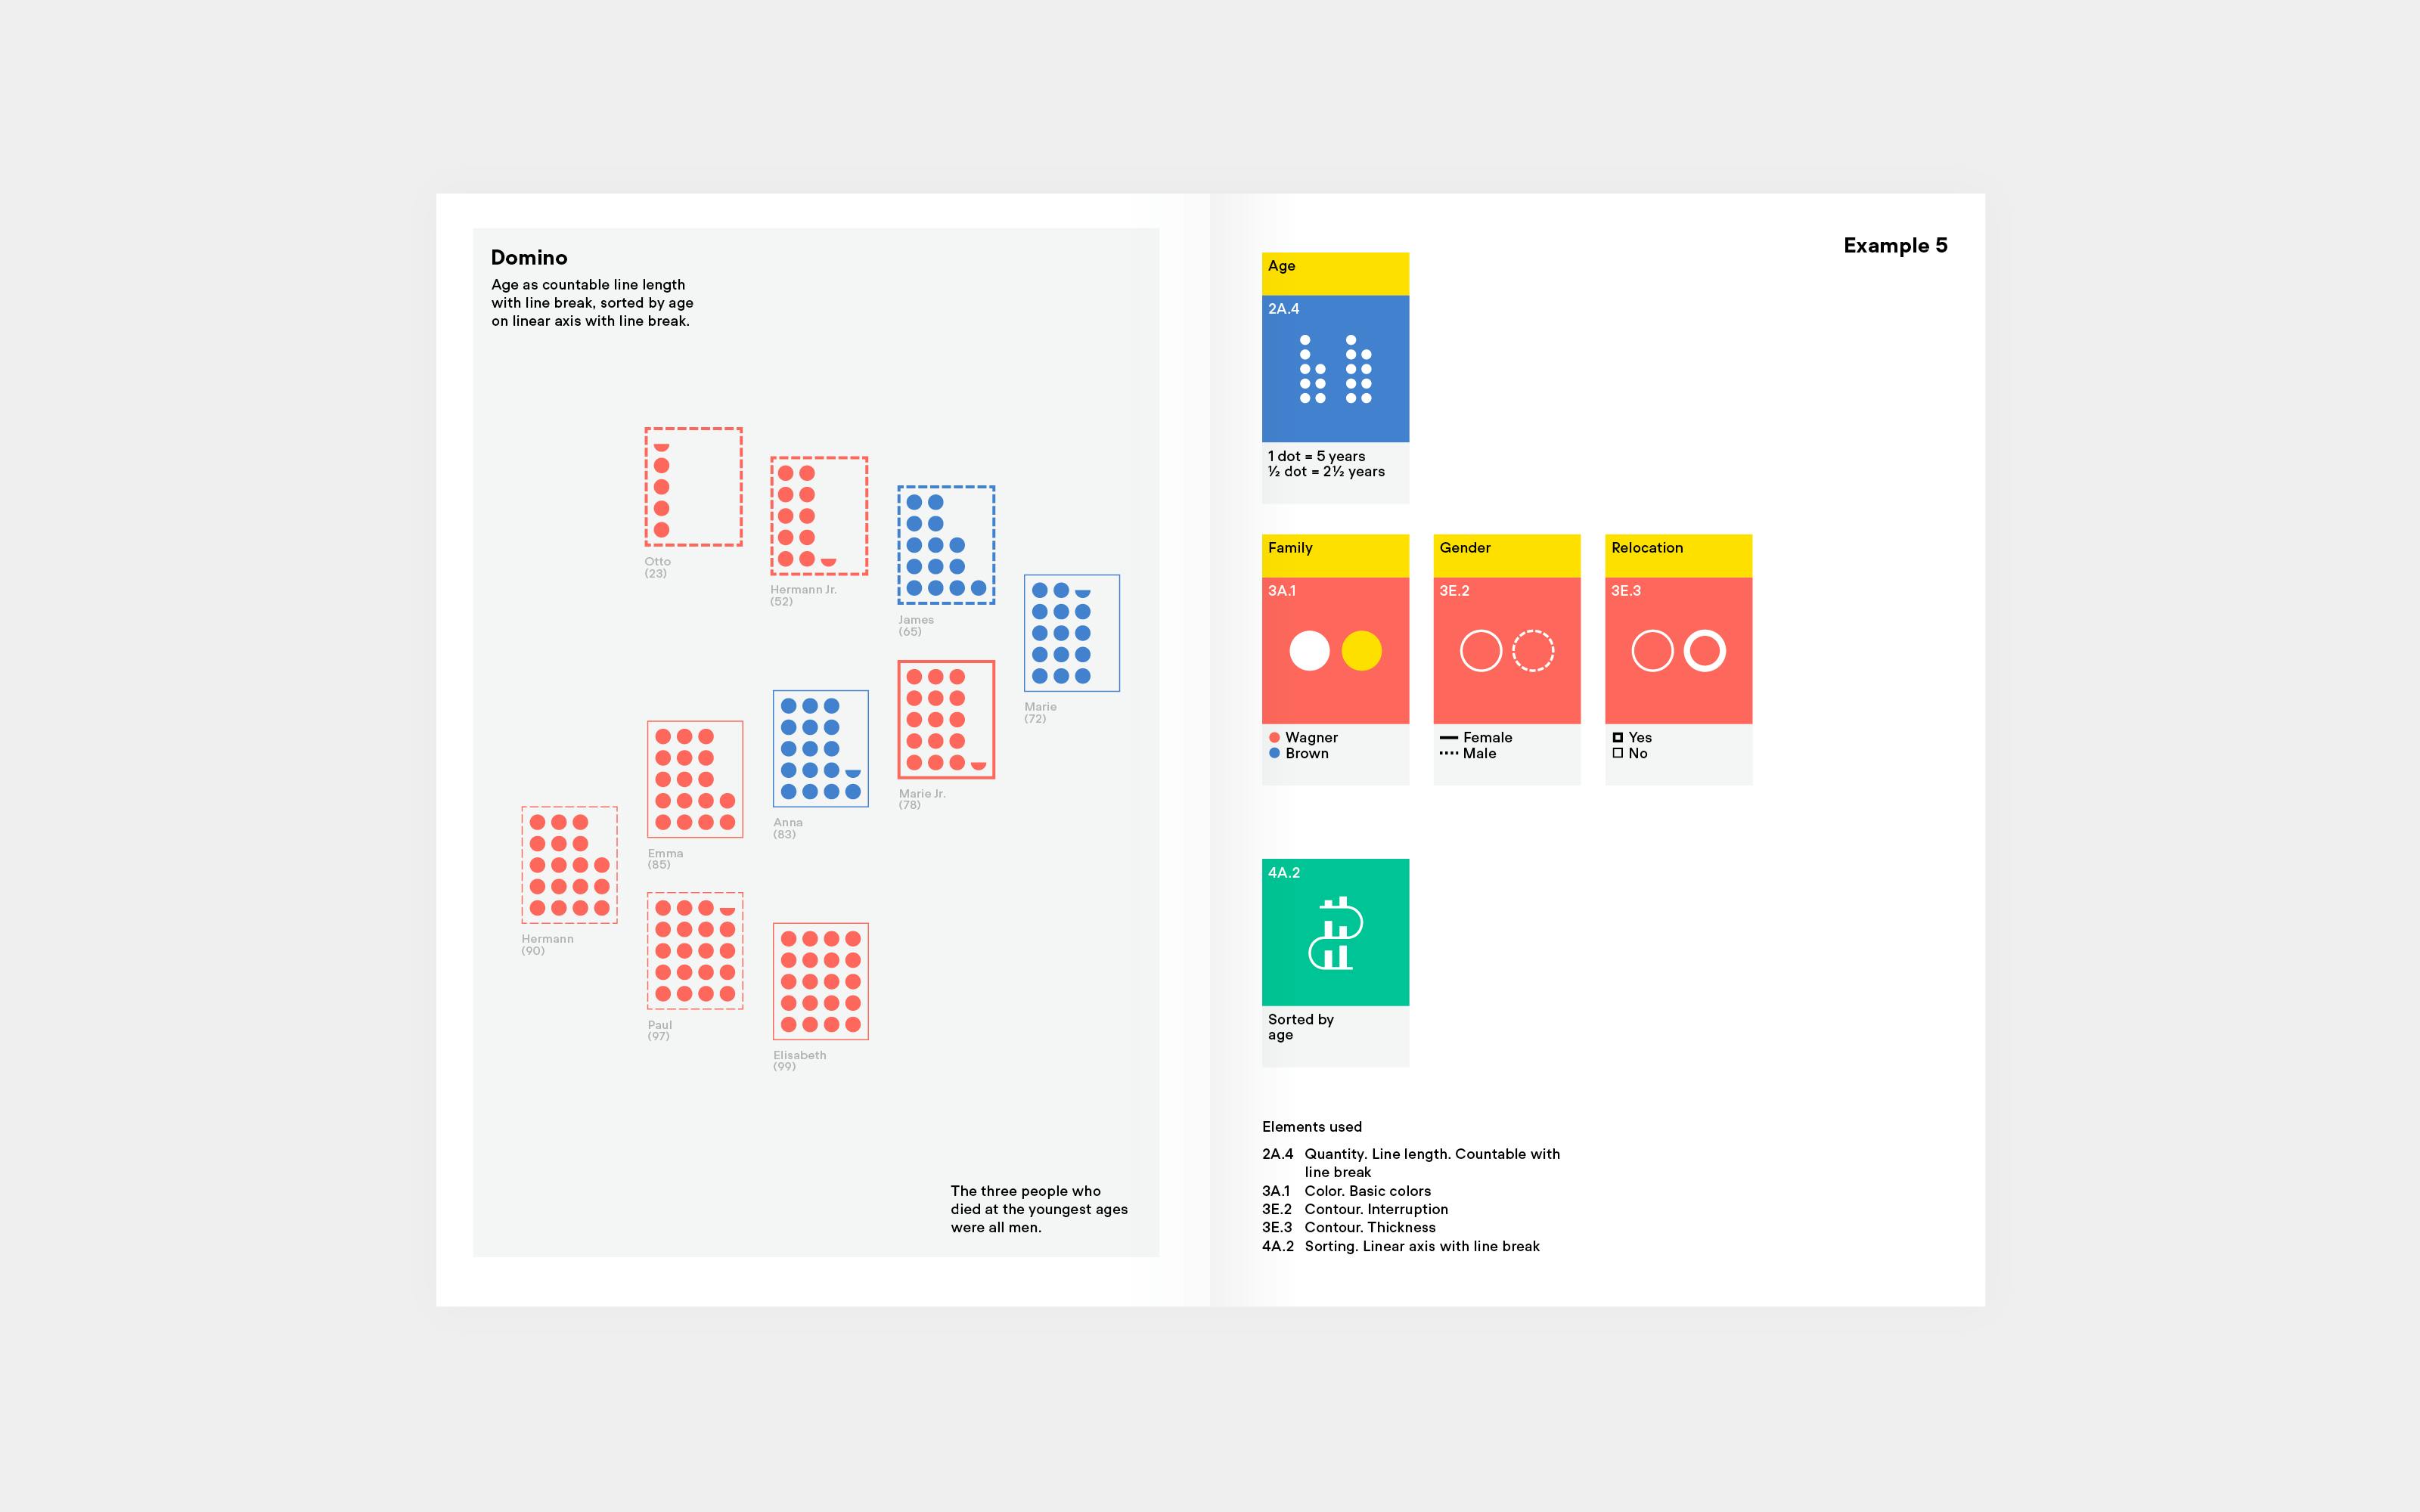
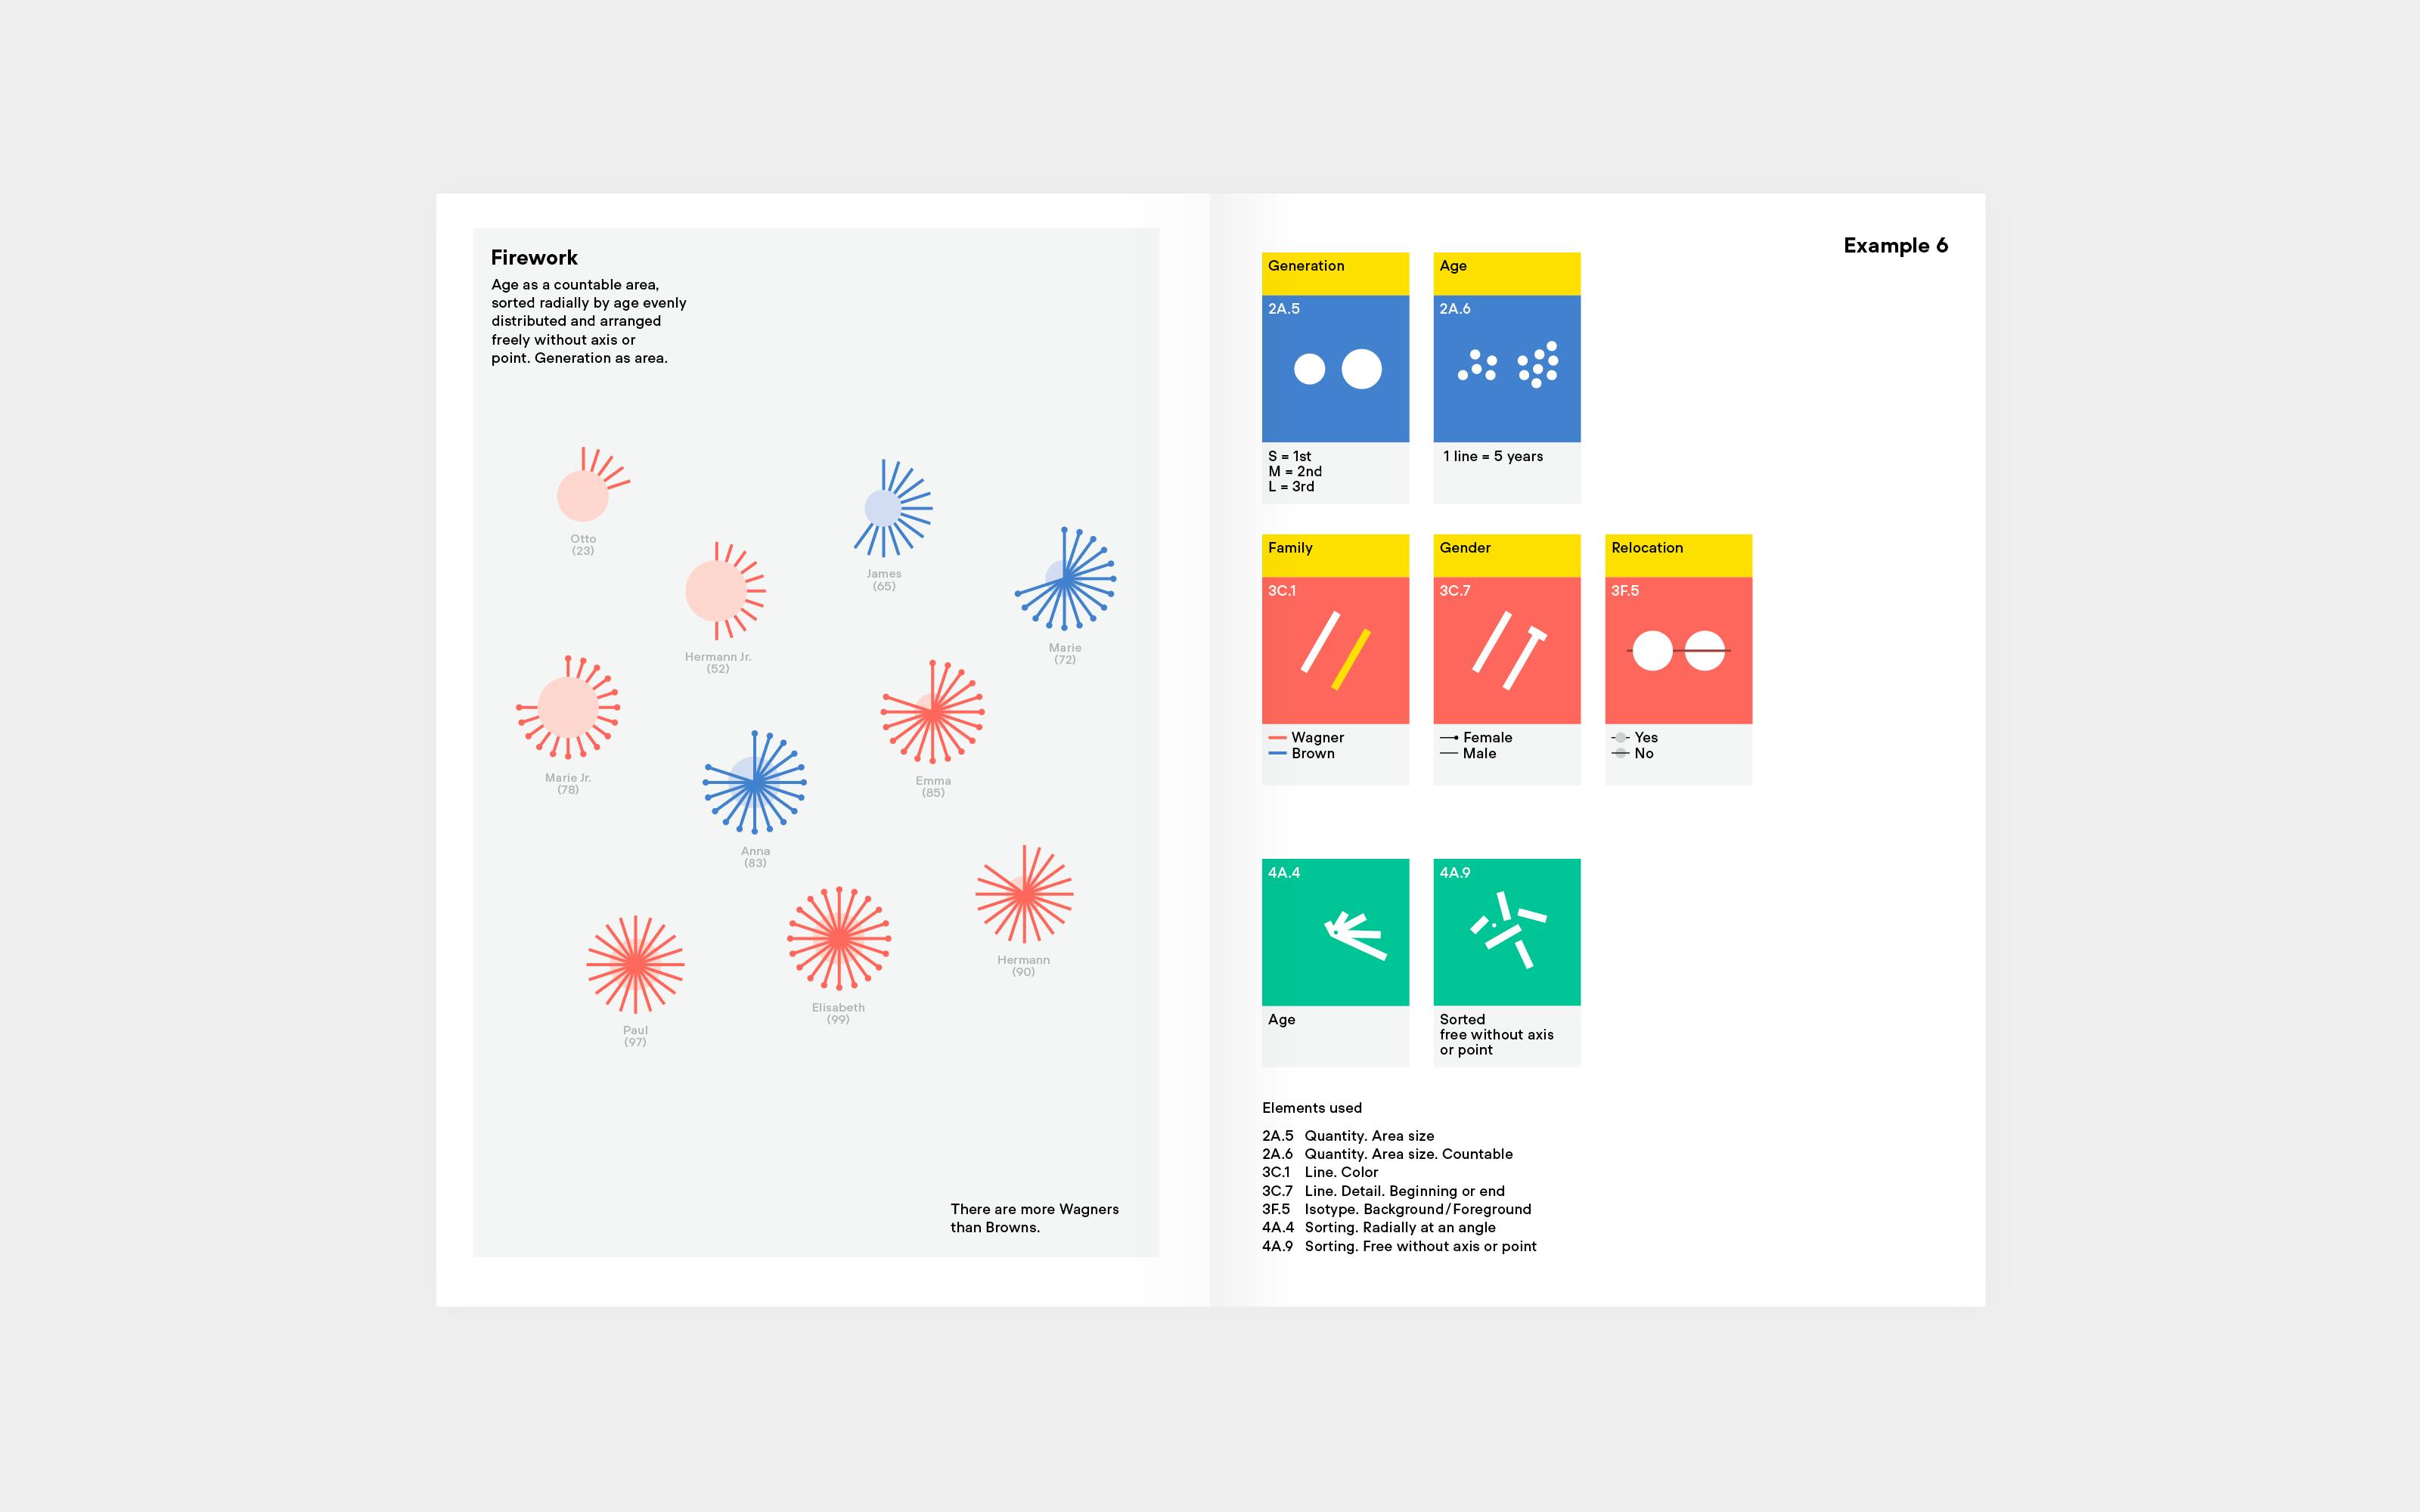
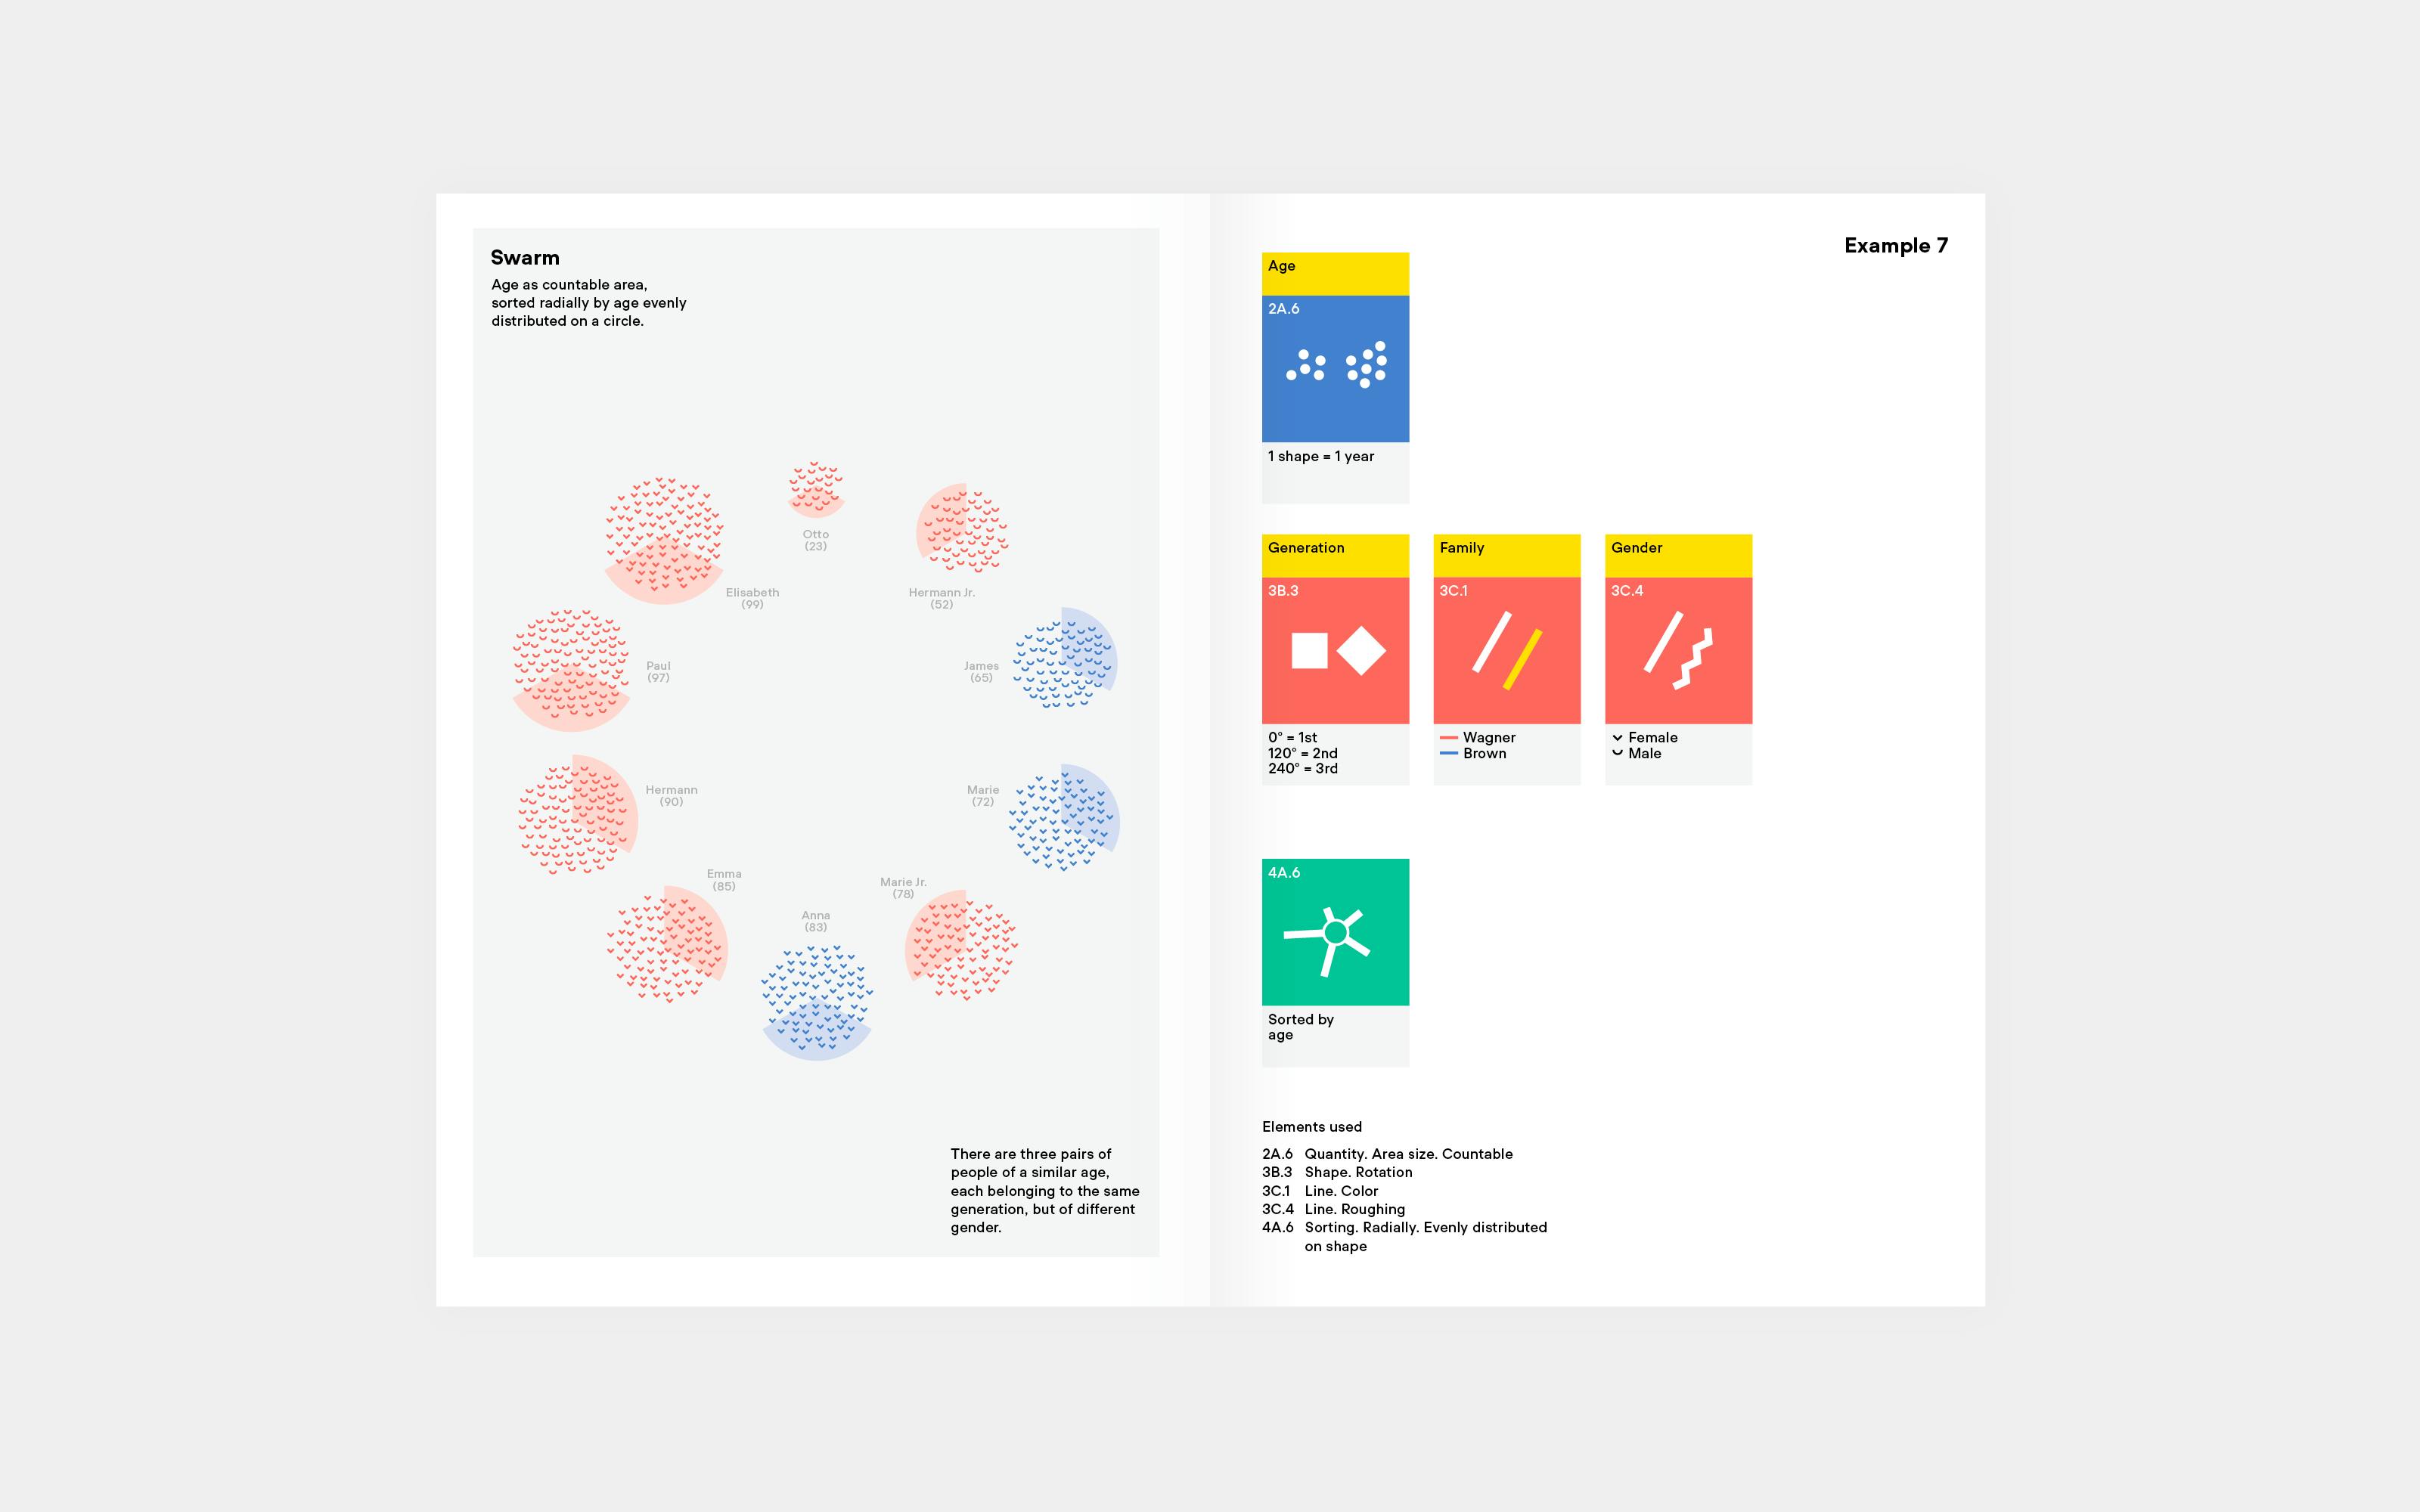
Consisting of 80 elements, organized into four dimensions, Visualizing Complexity brings data and Swiss graphic design together in a creative, coherent form, complemented by practical application examples. Our book explains the journey, from text to data, through a storyline that covers all steps necessary to create multidimensional visualizations.
Who is it for?
The MID Handbook is for anyone at the intersection of data science, design, journalism, communications, and academia. MID is a totally independent and accessible system. It can also be used with pen and paper. With an applied analog algorithm, visualizations can be built.
For designers who find data design too taxing
- The key to making complexity understandable is understanding the elements of complexity.
- We believe that the discipline of information design is graphic design with data, so it deserves the same amount of creativity.
For anyone who wants to understand how data design works
- We believe there is still a huge opportunity to present data in an accurate yet visually attractive way.
- We can do this independent of tools that do not allow or indeed block creativity.
Who are we?
MID was developed by Darjan Hil and Nicole Lachenmeier from the information design studio, Superdot. We're experts in explaining complexity through the language of design. We take complex information, visualizing it in a way that audiences can understand.
Because our field is still in its infancy, we wish to inspire and educate, providing guidance for creating information design projects. We share knowledge from over 10 years of practice and teaching to support the growth of the information design community.
Why people will buy the handbook?
Simple, beautiful, and easy to digest
- MID is much more than theoretical; it's application-oriented.
- It's written for anyone thinking about visualizing data.
- It's for anyone wishing to level up their chart design game.
A constant source of inspiration
- MID is a manual; all parts and instructions are put together in one place.
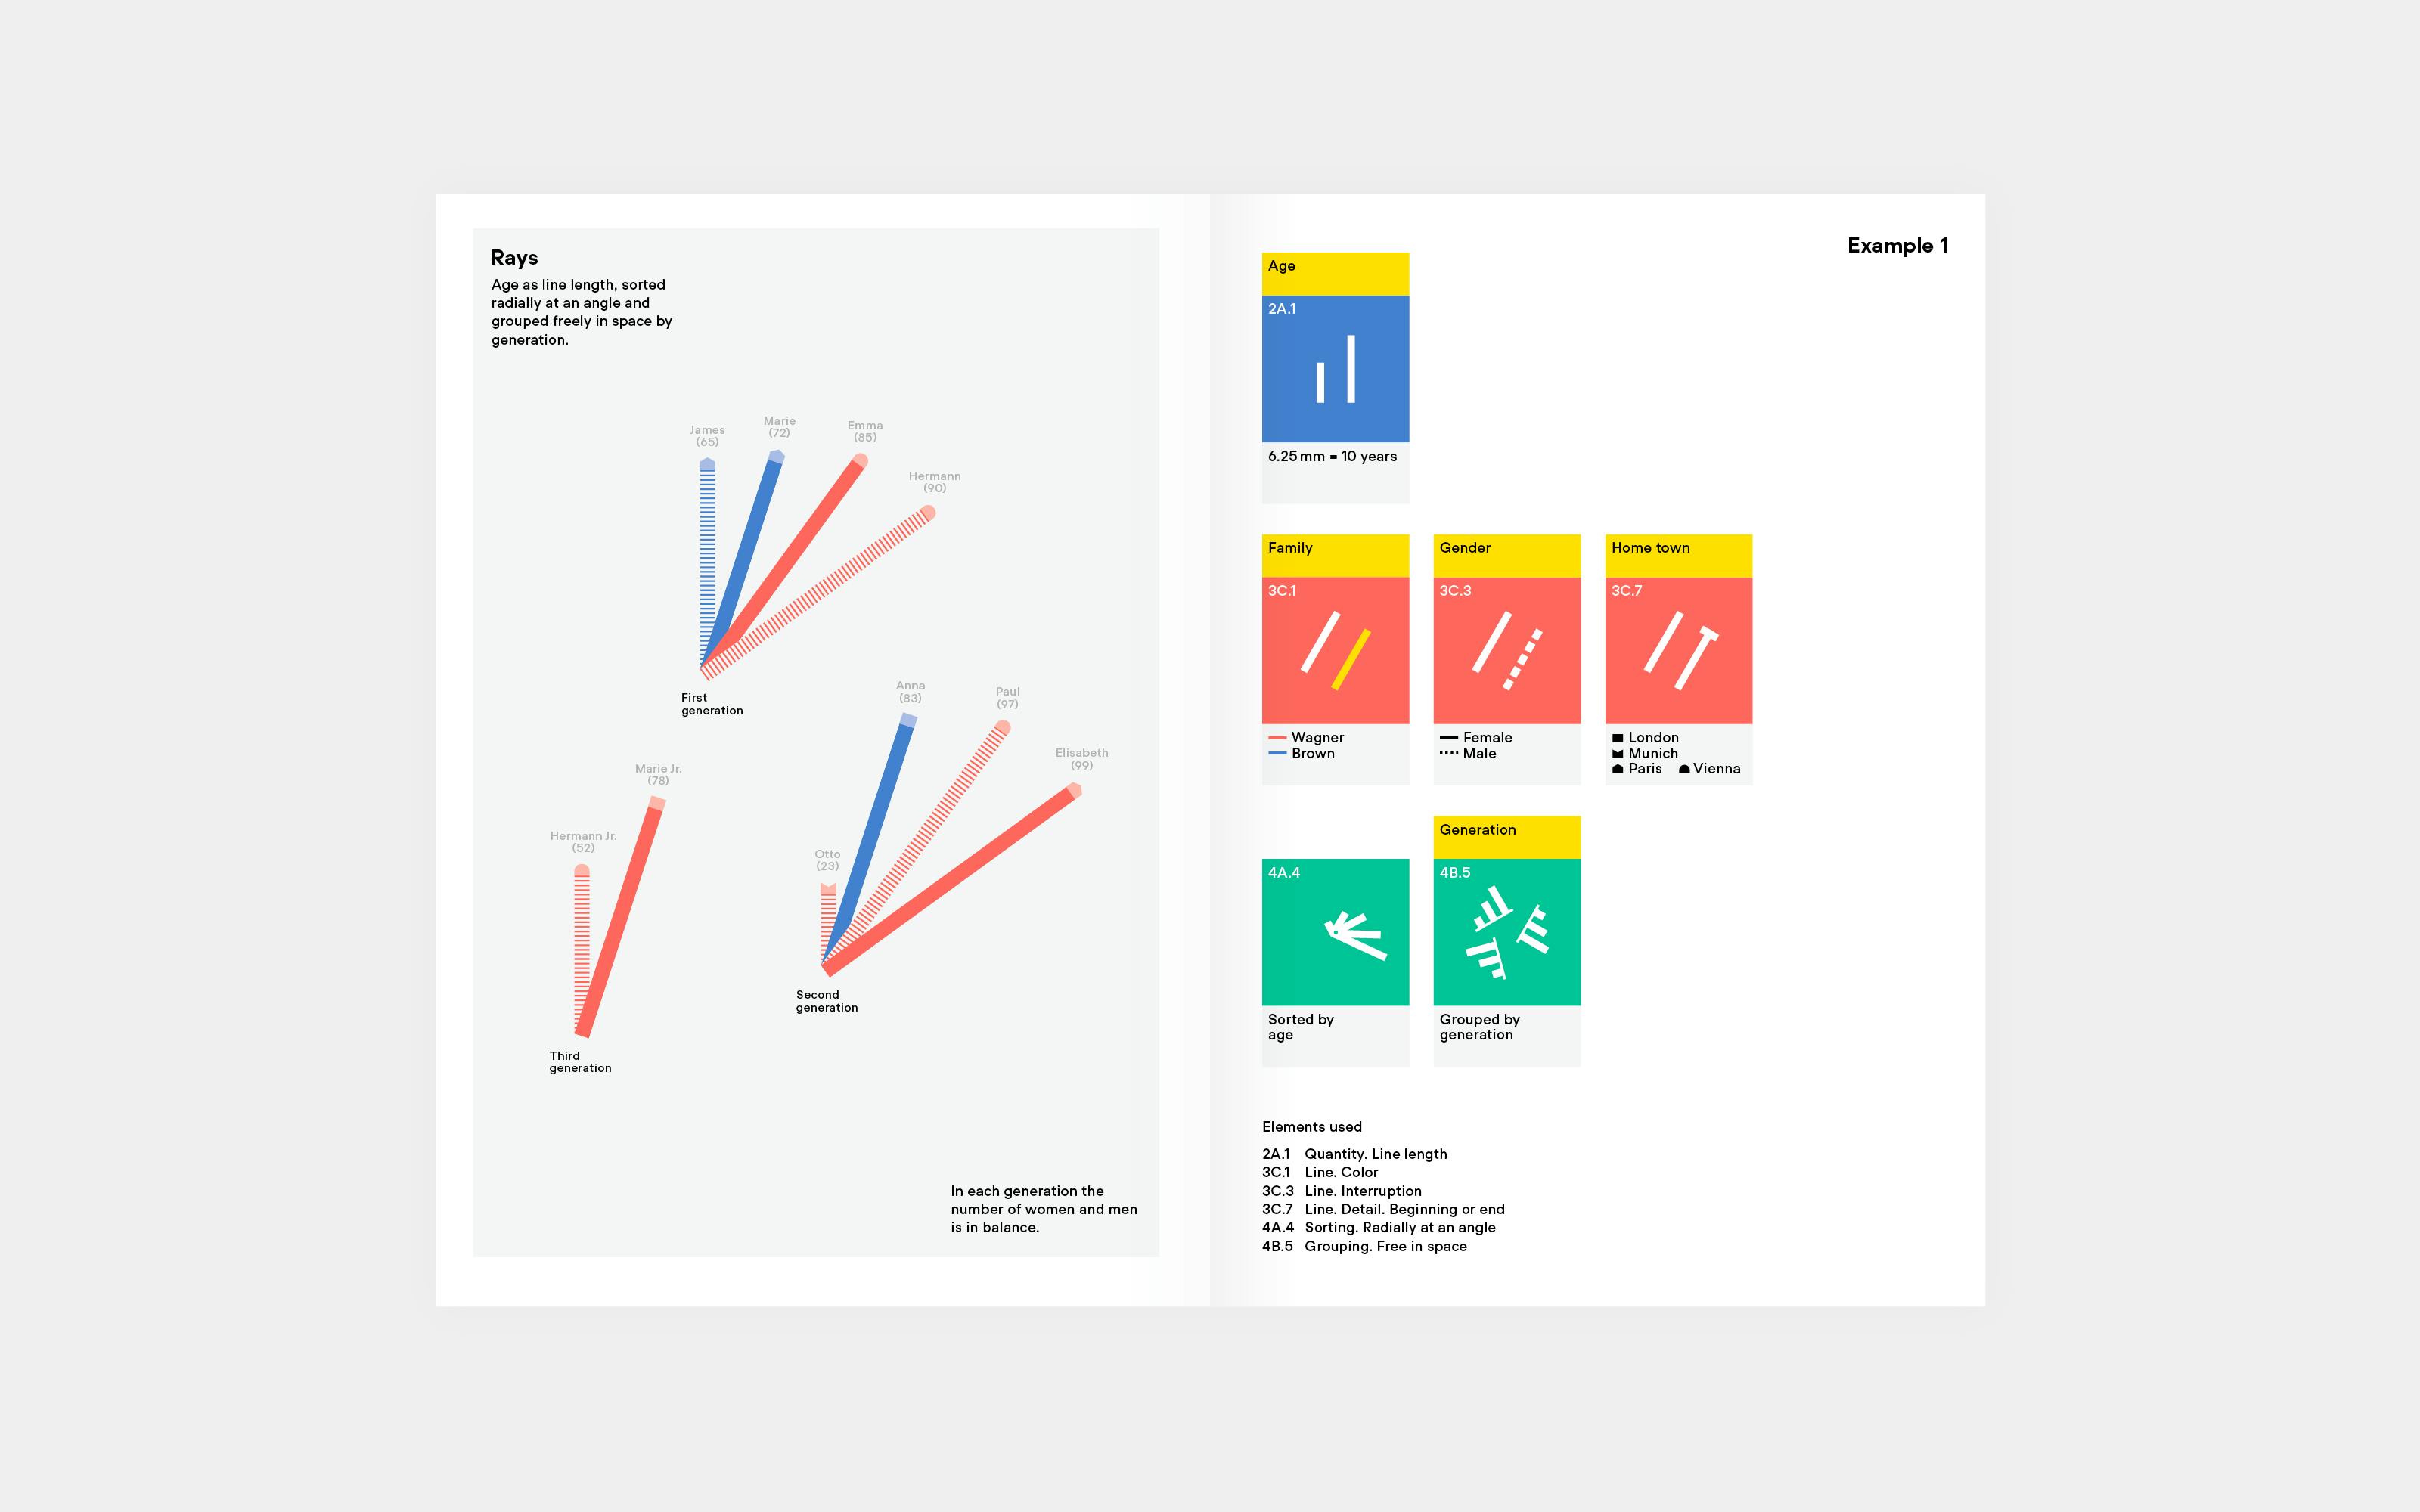
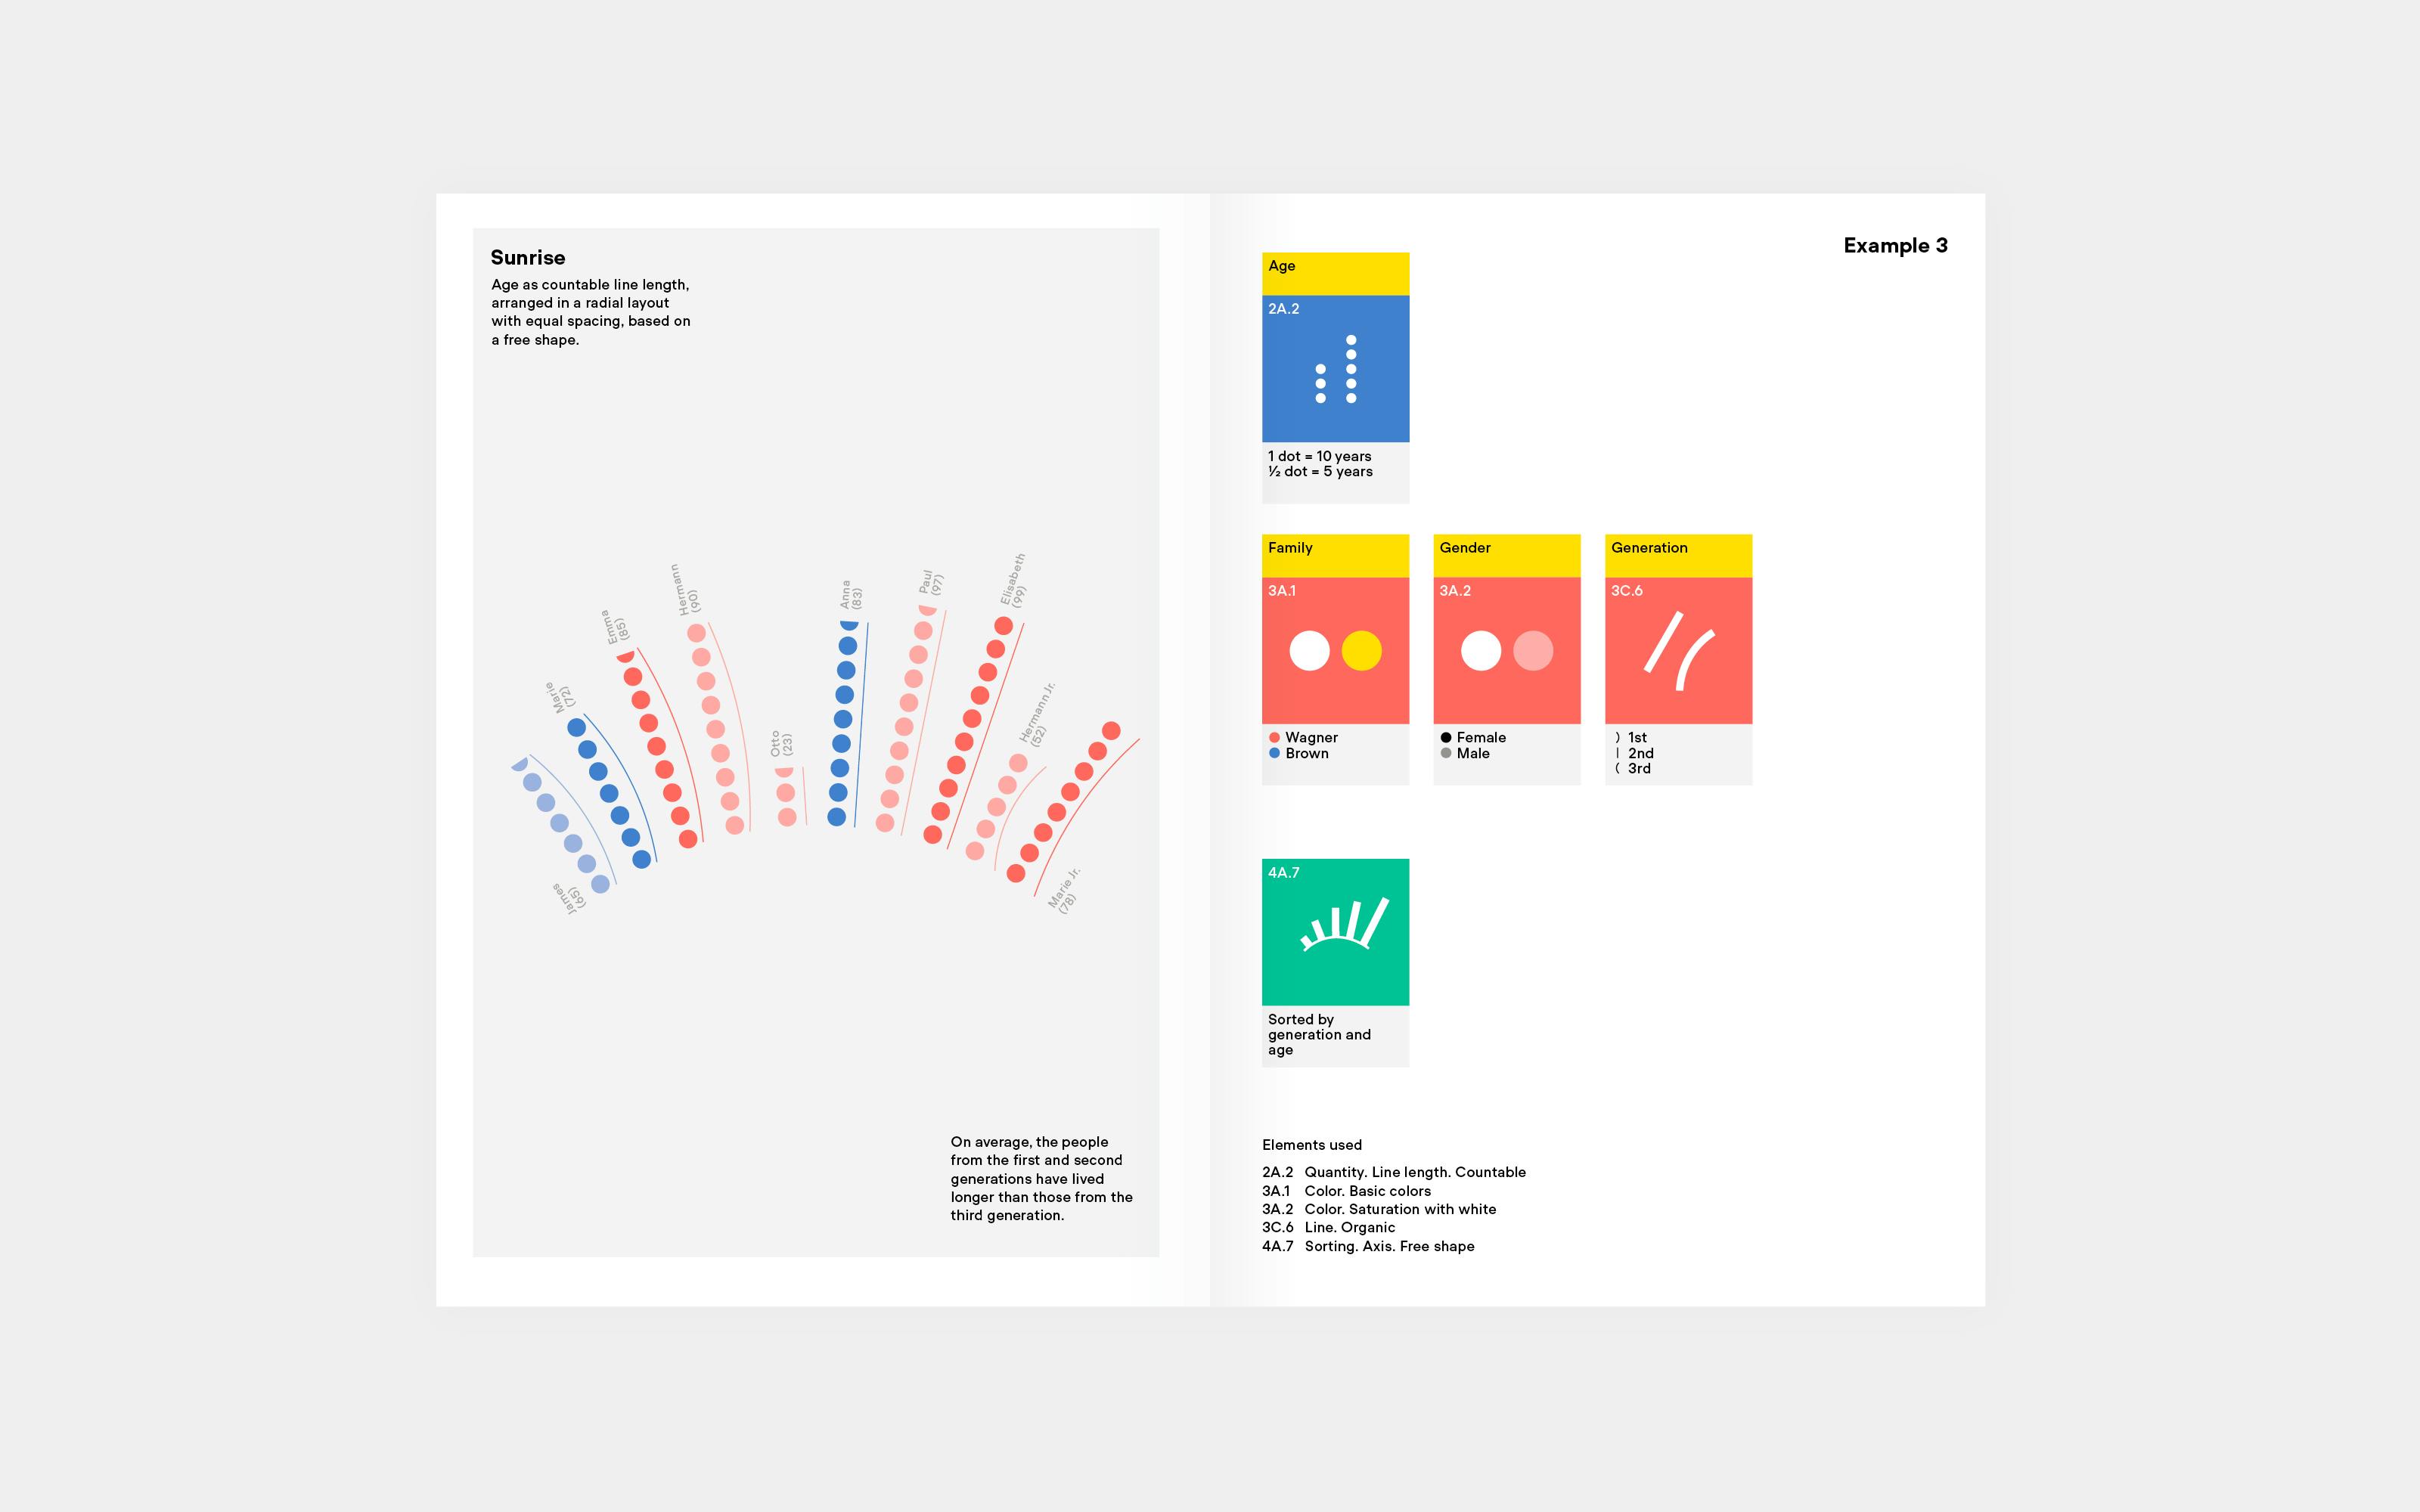
- Simple instructions for encoding and decoding allow readers to analyze and create appealing DataViz.
- With MID, there's no right or wrong; instead, readers are simply invited to explore and push their design boundaries.
Step-by-step, from text to data
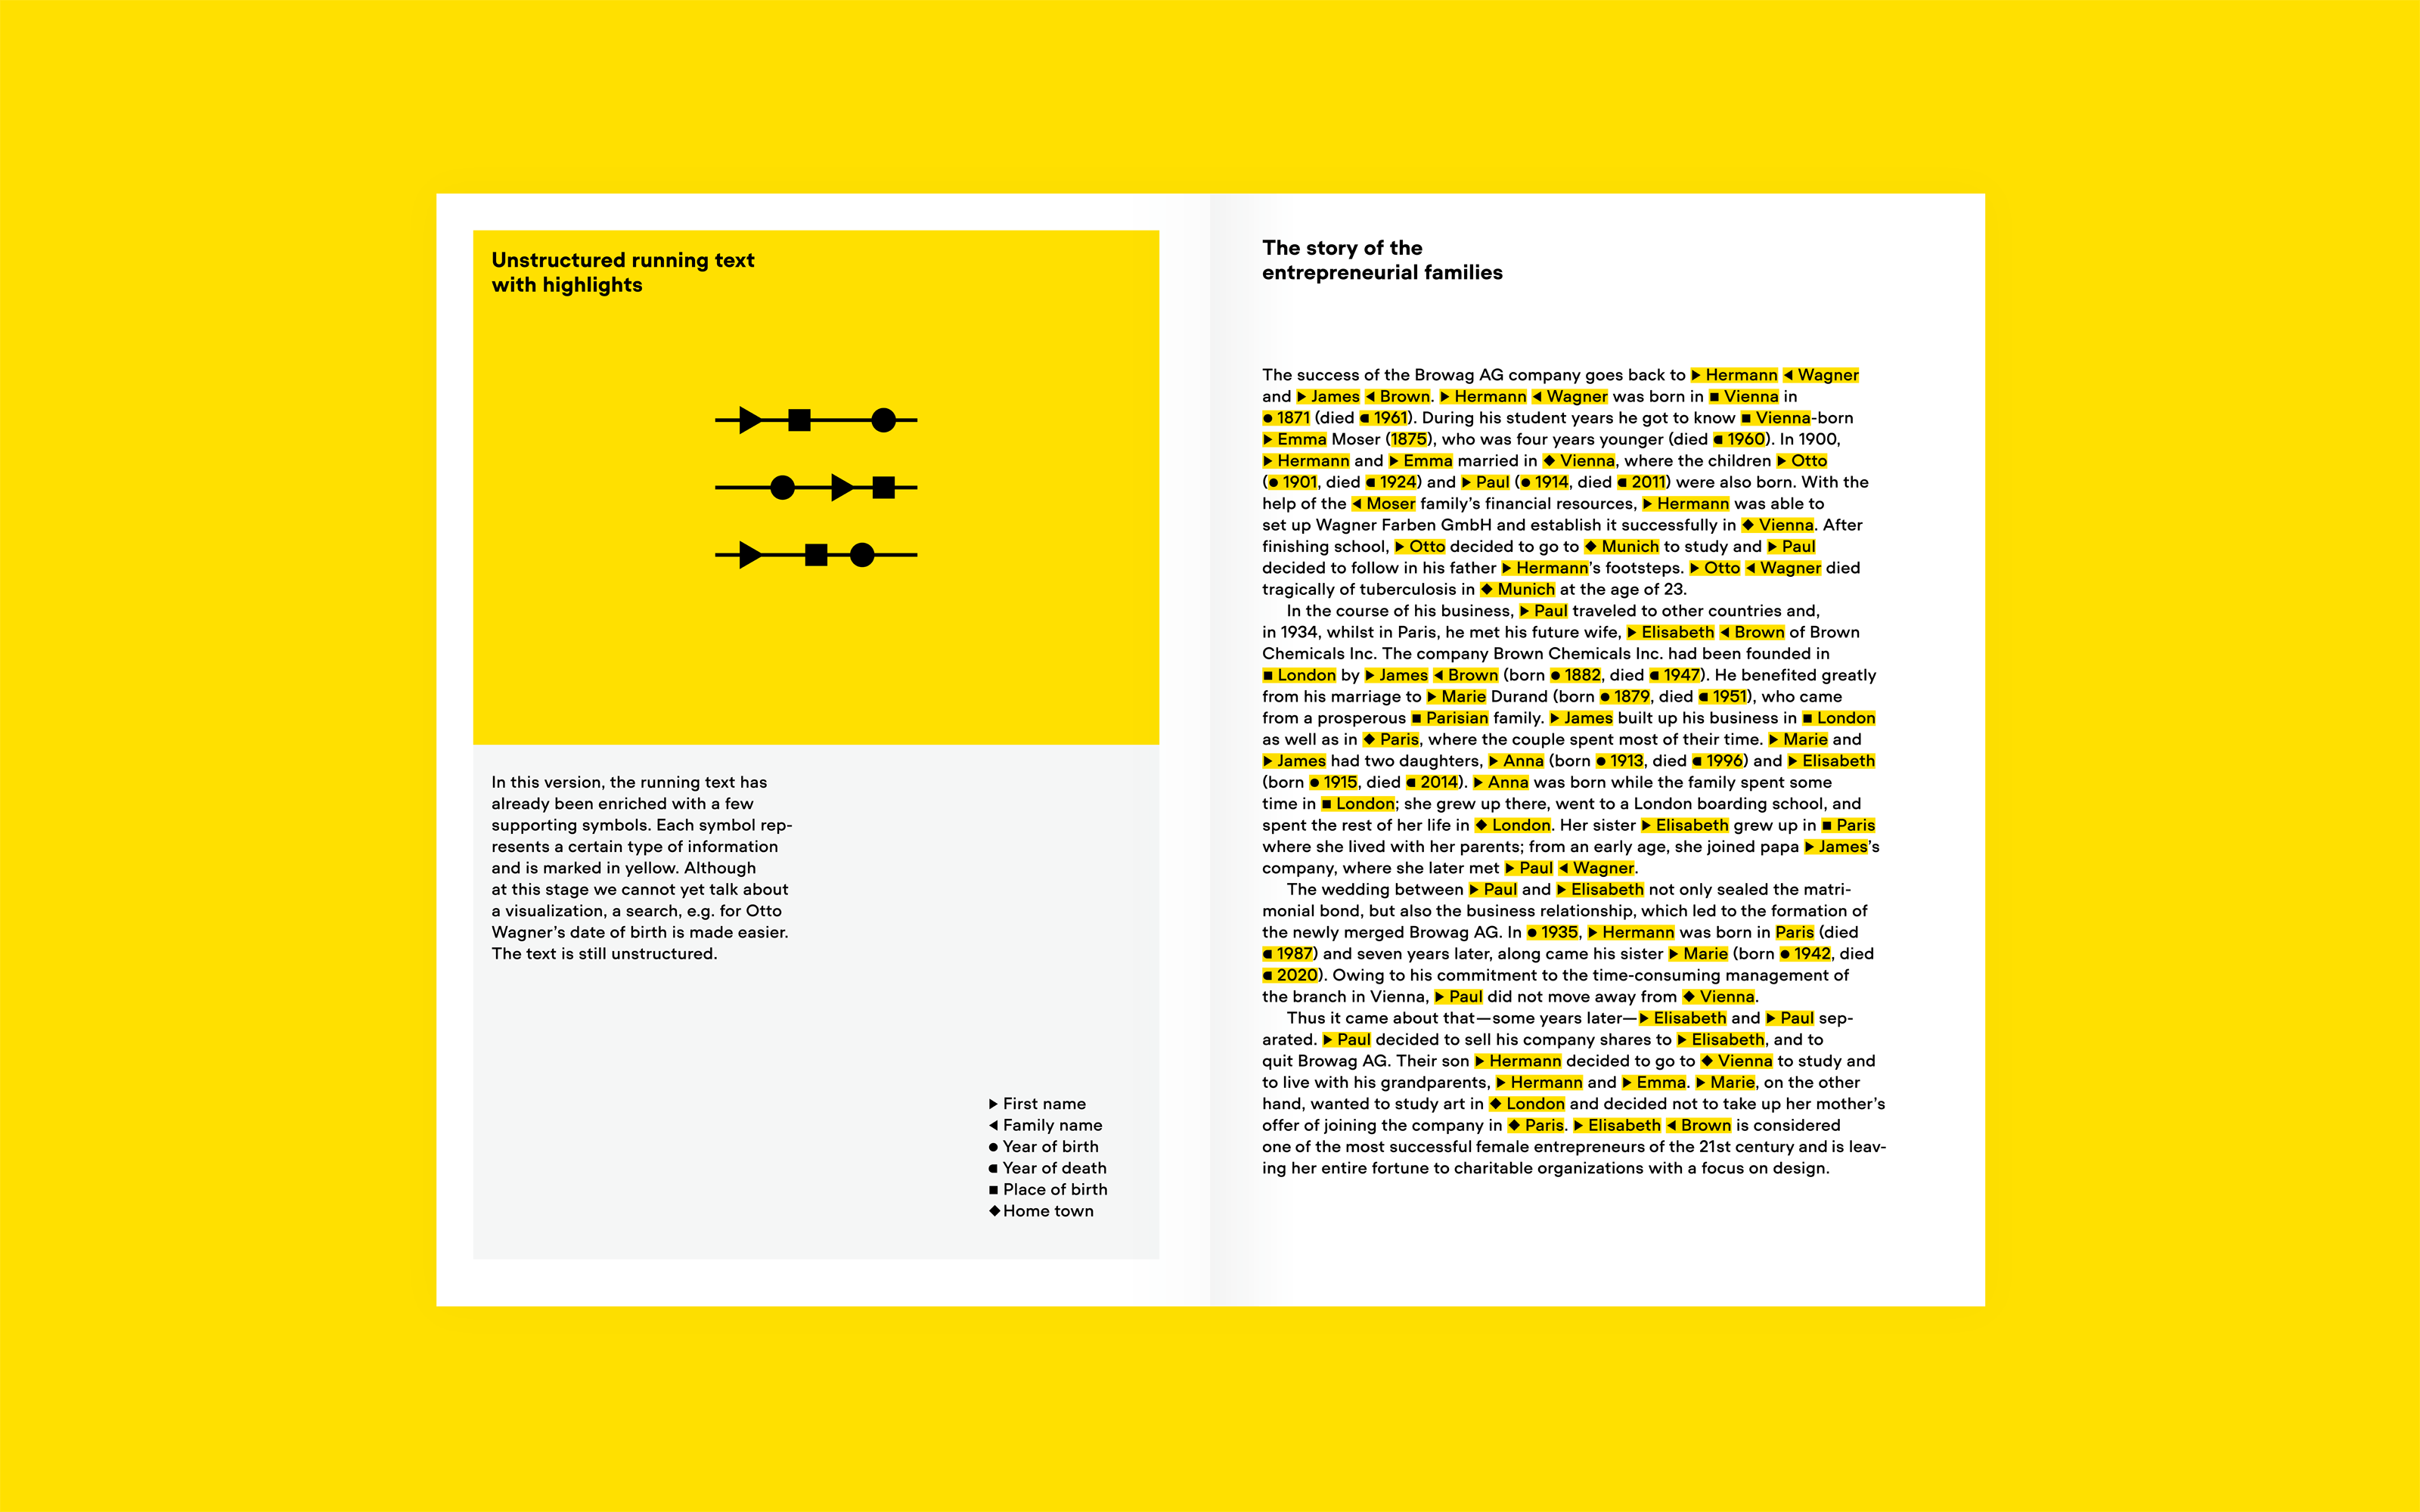
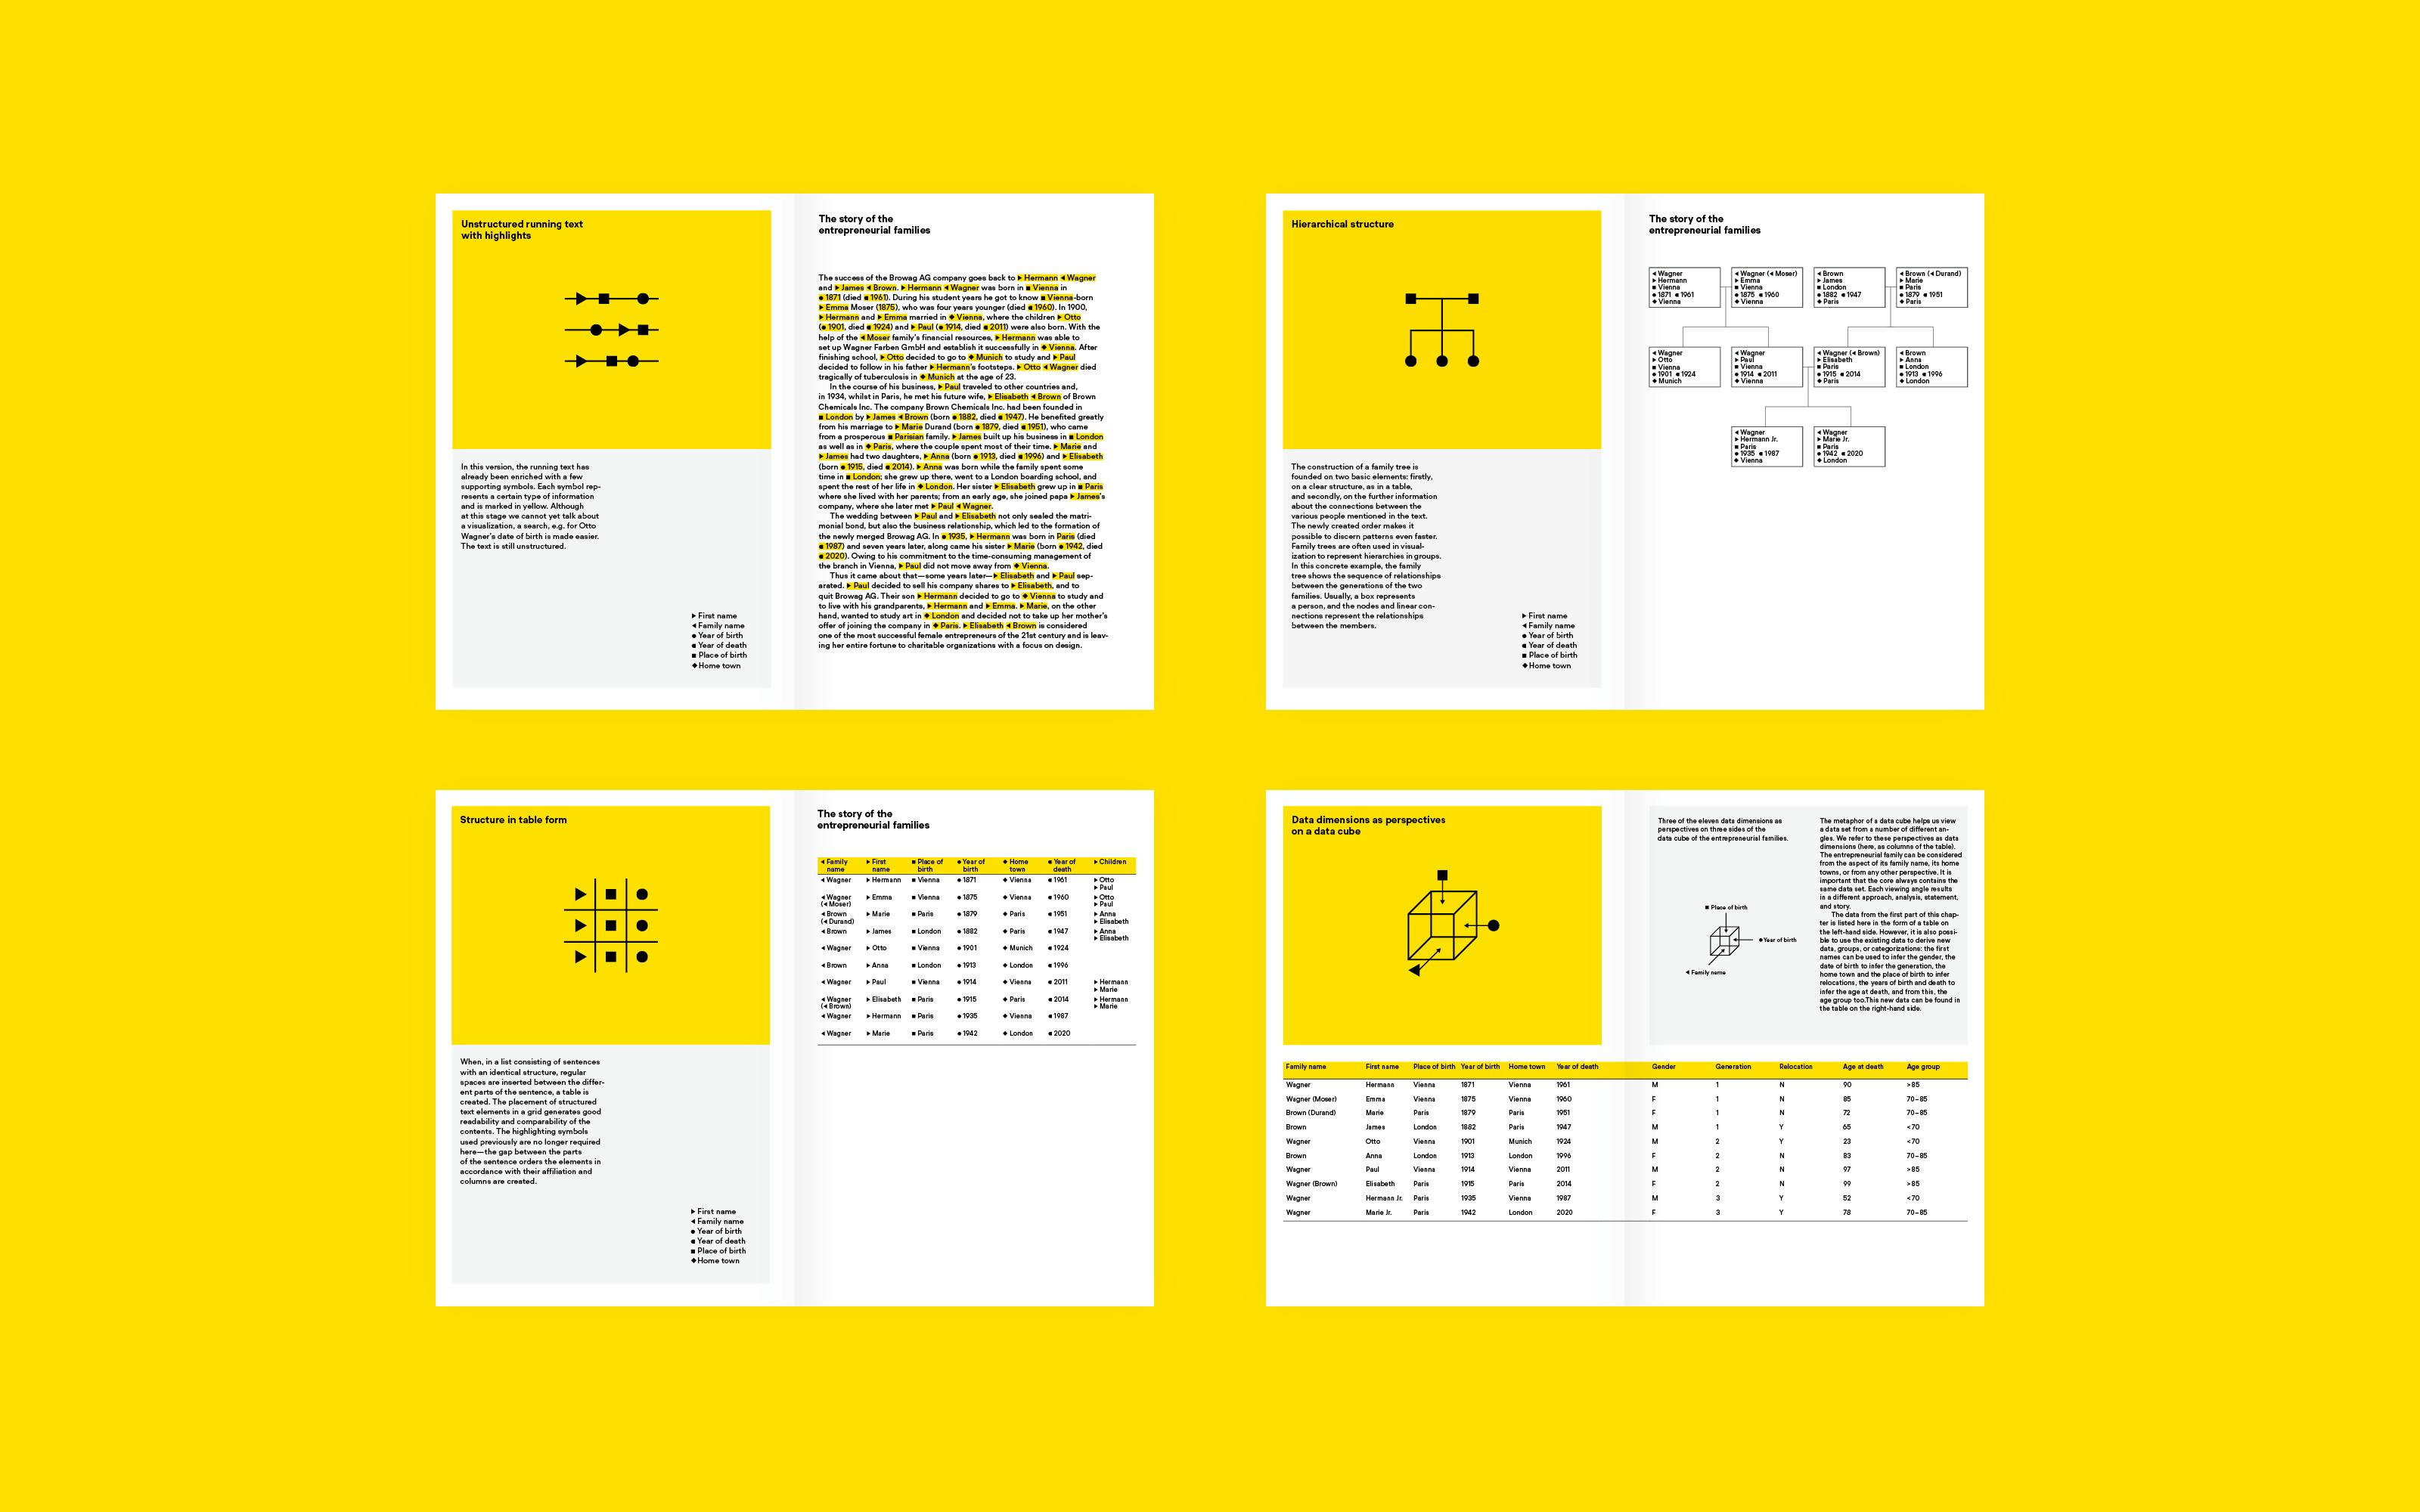
- MID graphically explains all steps from data to multidimensional visualization through a storyline that runs through the book.
- Demonstrates how you can transform unstructured text into structured data, ready for visualization.
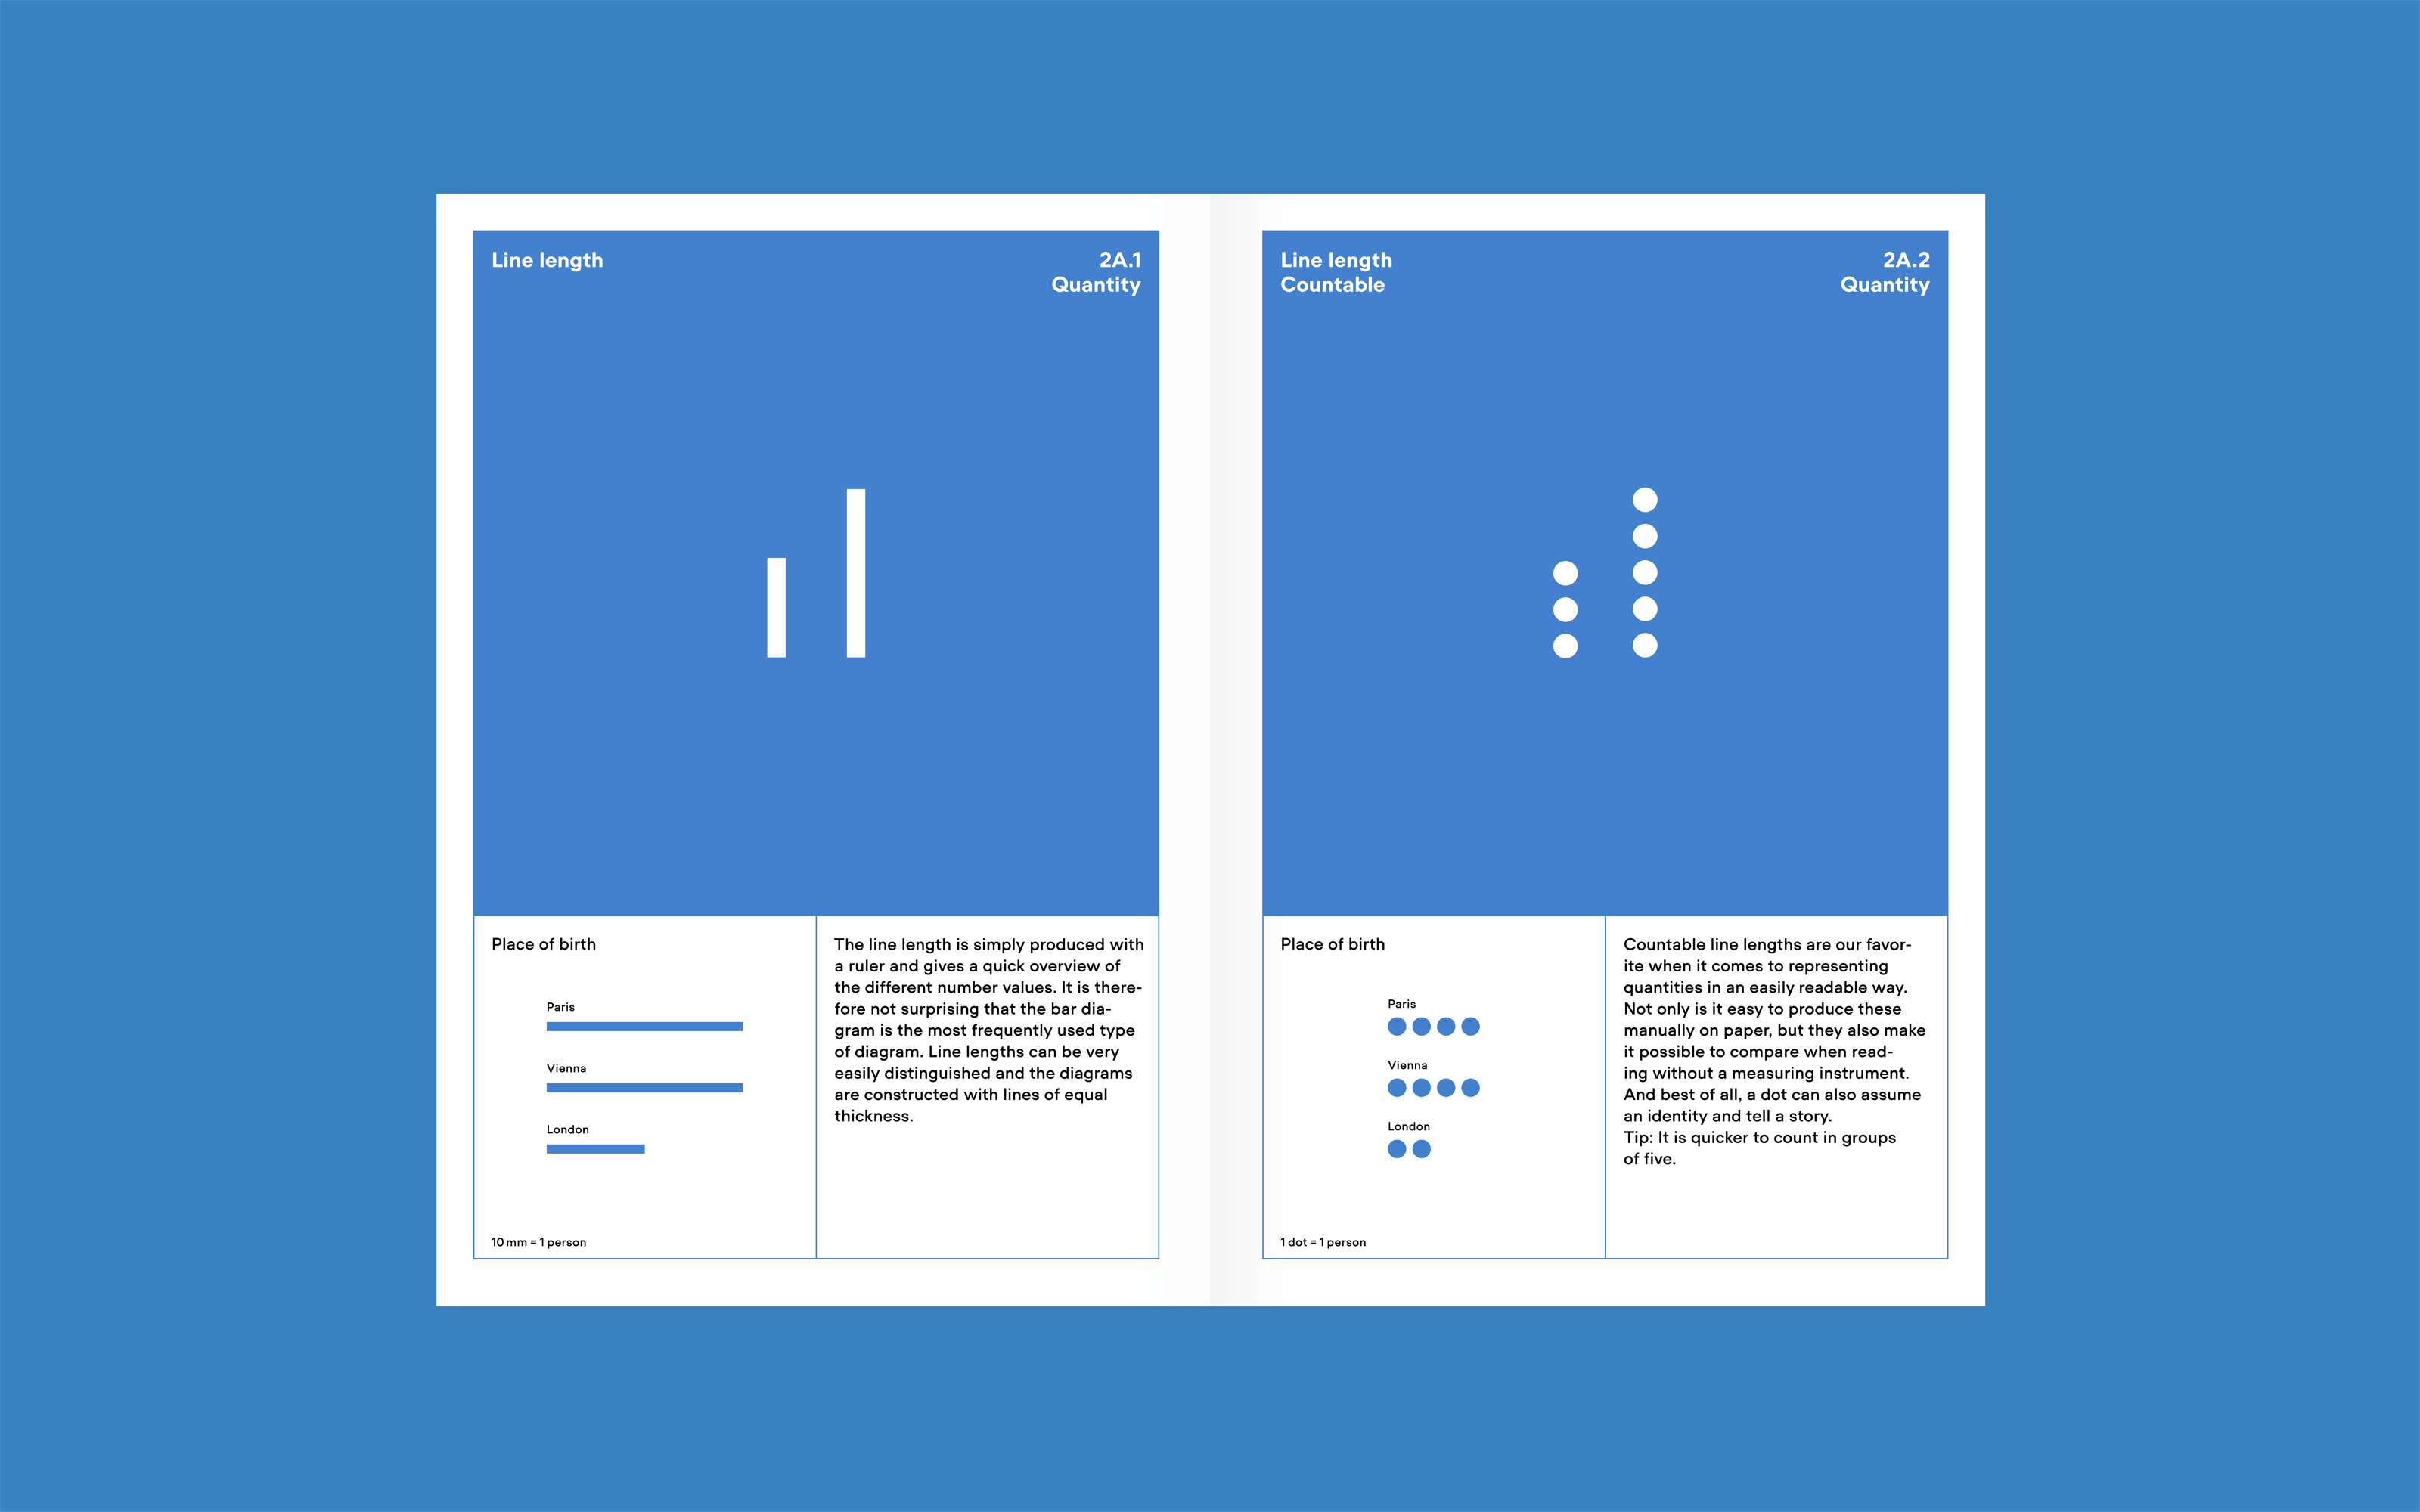
- The book demonstrates all elements of the MID, with instructions on how to use the system.
- There are multidimensional visualizations throughout.
Say goodbye to templates
- Designers can now avoid using standard diagrams or stock images as decoration.
- They can use design to get right to the point without going overboard.
- Encourages creativity with facts without distorting them.
In a nutshell?
- Handbook / manual format.
- Visual storytelling.
- Coffee table book.
- Easy fit for daypacks.
Are images and texts about MID available?
Yes, you can find images, texts and videos to feature «Visualizing Complexity – Modular Information Design Handbook» in articles or social media posts in our press kit.
Specifications of the book
Volume
224 pages
Format
158 × 228 mm
Languages
English or German
Publisher
Birkhäuser
Printing
High quality print and paper
Color
Printed with four Pantone spot colors
Production
Printed in Germany
We would like to take this opportunity to thank the 740 great Kickstarter backers from 43 countries. A special thanks goes to Cameron Banowsky who honored us with a very generous contribution to the campaign.